Download
1 / 27
270 likes | 457 Views
Umweltmeteorologie. 10. Troposphärisches Ozon. Prof. Dr. Otto Klemm. Troposphäre ohne Stickoxide und NMKW. 1. O 3 + h O( 1 D) + O 2 O( 1 D) + H 2 O 2 • OH 2. CO + O 2 + OH CO 2 + HO 2 3. CH 4 + OH • CH 3 + H 2 O • CH 3 + O 2 CH 3 O 2 •

E N D
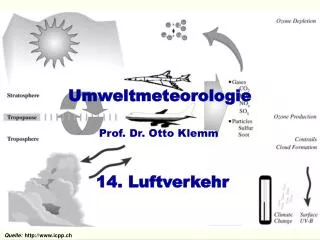
Umweltmeteorologie 10. Troposphärisches Ozon Prof. Dr. Otto Klemm
Troposphäre ohne Stickoxide und NMKW 1. O3 + h O(1D) + O2 O(1D) + H2O 2 •OH 2. CO + O2 + OH CO2 + HO2 3. CH4 + OH •CH3 + H2O •CH3 + O2 CH3O2• CH3O2•+ HO2 CH3OOH + O2 (MHP) CH3OOH + OH H2O + CH3O2•2/3 H2O + CH2OOH 1/3 CH2OOH CH2O + OH
troposphärisches Ozon • Quellen: • Transport aus der Stratosphäre • Photolyse des NO2 8. NO2 + h O(3P) + NO O(3P) + O2 O3 • Senken: • Deposition zu den Oberflächen • Photolyse • Reaktionen mit VOCs • Reaktion mit NO (reversibel!) • Reaktionen mit Aerosolpartikeln?
Troposphäre ohne Stickoxide und NMKW 4. CH2O + h HCO + H 340 nm H + O2 HO2 HCO + O2 CO + HO2 CH2O + h H2 + CO 360 nm CH2O + •OH HCO + H2O 5. HO2•+ HO2• H2O2 + O2 H2O2 + OH H2O + HO2• H2O2 + h 2 OH 6. HO2•+ O3 •OH + 2 O2
Troposphäre mit Stickoxiden Zusätzliche Reaktionen: 7. NO + O3 NO2 + O2 8. NO2 + h O(3P) + NO O(3P) + O2 O3 9. NO + •HO2 NO2 + OH 10. NMKW + •OH R• R• + O2 RO2• 11. CH3O2•+ NO CH3O• + NO2 12. NO2 + •OH HNO3
CH4 CH2O 3 4 CO 2 HO2 OH 5 H2O2 6 1 O3
CH4 CH2O 3 4 CO 2 HO2 OH 5 H2O2 9 HNO3 12 NO2 NO 8 6 7 1 O3 10 11 NMKW RO2
„EKMA“ - Plots städtischer Bereich ländlicher Bereich Quelle: Chameides et al. (1992): Ozone Precursor Relationships in the Ambient tmosphere. JGR 97, 6037-6055. trop. Regenwald remote marine
„VOC-limitiert“ „NOx-limitiert“ VOC- sensitiv NOx- sensitiv Überlappungsbereich Quelle: Klemm & Stockwell, 1999
Bewertung der relativen Rollen von NOx und NMKW bei der O3-Produktion Sensitivity die O3-Bildung ist VOC-sensitiv, wenn und entsprechend NOx-sensitiv, wenn Vorsicht: kann negativ sein. Limitation Die O3-Bildung ist NOx-limitiert, wenn > 0 die O3-Bildung ist VOC-limitiert, wenn < 0
= 5 ... 15 Quelle: Trainer et al.
Immissionswert Zeitbezug Schutzobjekt Verbindlichkeit 22. BImSchV 65 µg/m³ Tagesmittelwert Vegetation Schwellenwert 200 µg/m³ 1-Std-Mittelwert Vegetation Schwellenwert 110 µg/m³ 8-Std-Mittelwert Menschliche Gesundheit Schwellenwert 180 µg/m³ 1-Std-Mittelwert Menschliche Gesundheit Schwellenwert 360 µg/m³ 1-Std-Mittelwert Menschliche Gesundheit Schwellenwert BImSchG 240 µg/m³ 1-Std-Mittelwert Menschliche Gesundheit Schwellenwert EG-Richtlinie 92/72/EWG wie 22. BImSchV wie 22. BImSchV Menschliche Gesundheit Schwellenwert VDI-Richtlinie 2310 Bl. 15 120 µg/m³ 30-Min-Mittelwert Menschliche Gesundheit Richtwert WHO 150 - 200 µg/m³ 1-Std-Mittelwert Menschliche Gesundheit Leitwert Grenz- und Schwellenwerte für Ozon EU hat folgende "Schwellenwerte" festgelegt und mittels der 2. Bundesimmissionsschutzverordnung (BImSchV) in das deutsche Immissionsschutzrecht übernommen: aus: Abschlussbericht Seminar Atmosphärische Chemie, SS 1998
Ozon – Episoden im regionalen Maßstab Berechnete Ozonkonzentration in ppb in ca. 0 bis 40 m Höhe um 14 UTC oder 16 Uhr MESZ, 13. August 1997 (linkes Bild). Über Nordrhein-Westfalen liegt ein Band erhöhter Ozonkonzentrationen, das sich von der Schweiz bis zur Nordsee erstreckt. Bereits am nächsten Tag (rechtes Bild) wird dieser Bereich nach Osten verschoben sein. Quelle: EURAD-Projekthttp://www.uni-koeln.de/math-nat-fak/geomet/eurad
EURAD Modellsystem EURAD zur Prognose von Luftschadstoff-konzentrationen in der Mesoskala Quelle: http://www.uni-koeln.de/math-nat-fak/geomet/eurad/
O3 – Vorhersage (EURAD) Vergleich von Vorhersage und Messung, Tagesmittelwerte für Münster Quelle: http://www.uni-koeln.de/math-nat-fak/geomet/eurad/index.html?/math-nat-fak/geomet/eurad/publikationen/lua.html
Ozon – Zeitreihe im Fichtelgebirge Stundenmittelwerte (ppb)
Ozon - Trends Ozon – Mischungsverhältnisse im Fichtelgebirge. Dargestellt sind Perzentilen der Stundenmittelwerte der Kalenderjahre
O3 - Trend in NRW data source: http://www.lua.nrw.de/
O3 - Trend global Oltmansa et al. (2006) Long-term changes in tropospheric ozone, Atmospheric Environment 40, 3156–3173
global OH Jos Lelieveld: Self-cleaning capacity of the atmosphere and land-biosphere processes
global OH Rohrer, F. & Berresheim, H. (2006) Strong correlation between levels of tropospheric hydroxyl radicals and solar ultraviolet radiation. Nature442, 184-187. Correlation of measured OH concentrations with simultaneously observed ozone photolysis frequencies, J(O1D). The data represent 5-min averages measured at the Meteorological Observatory Hohen-peissenberg between April 1999 and December 2003 (N < 52,000).
global OH Jos Lelieveld: Self-cleaning capacity of the atmosphere and land-biosphere processes
global OH Jos Lelieveld: Self-cleaning capacity of the atmosphere and land-biosphere processes