Download
1 / 26
260 likes | 411 Views
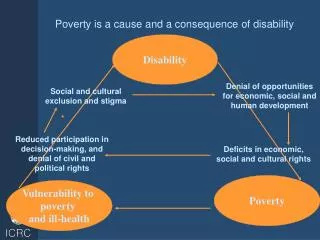
8.0. 7.0. 6.0. 5.0. 4.0. 3.0. 2.0. 1.0. 0.0. 1860. 1880. 1900. 1920. 1940. 1960. 1980. The energy Consumption is a Consequence of the Industrial Development. Annual Energy Consumption (10 12 Watts). Year. Energy Production. Increase of the Pollution Levels. Carbon dioxide. CO.

E N D
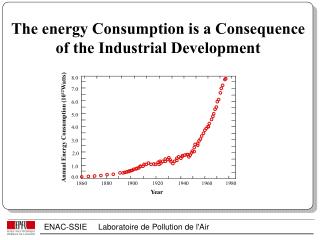
8.0 7.0 6.0 5.0 4.0 3.0 2.0 1.0 0.0 1860 1880 1900 1920 1940 1960 1980 The energy Consumption is a Consequence of the Industrial Development Annual Energy Consumption (1012Watts) Year
Carbon dioxide CO 2 Sulfur Oxides SO 2 NO Nitrogen Oxides x Hydrocarbons VOC Main Emissions produced by the Fossil Fuels Global Warming Acid Rain Air Toxicity Photo-oxidant formation
20 Ozone impact on the yield of the wheat grain 1.2 Asthma symptoms Hospital admissions Mortality 15 1.0 0.8 10 % change in health effects indicators 0.6 Relative Yield 1986 5 1987 1988 0.4 1989 1990 0.2 Mean 86-88 0.0 Mean 89-90 0 100 200 300 400 0.0 120 40 60 80 100 0 20 Change in PM10 daily concentrations [mg.m-3] Ozone [ppb] Pollution Effects Agricultural Production: Human Health:
Other Effects • Buildings deterioration • Visibility deterioration Denver (US) PhotochemicalEpisode “Clean“Atmosphere
Before WWII SMOG (Smoke + Fog) Pollution Characteristics: - winter episodes, (cold and humid), sulfur Oxides (SOx), acids (H2SO4), particulates matter (PM) - 4 SourcesCharacteristics: - bad fuels and combustion, - emissions produced by the industries and the heating.
After WWII PhotochemicalSMOG PollutionCharacteristics : - Summer episodes, (warm and sunny), - photo-oxidants (O3, PAN), acids (HNO3), fine particulates matter. SourcesCharacteristics : - better fuels and combustion, - emissions produced by the traffic (mainly) and the industries.
DISPERSION TRANSFORMATION EMISSIONS DEPOSITION (transport and turbulence) (chemistry) Secondary Pollutants sun H SO 2 4 Photooxidants humidity O , PAN 3 Primary Pollutants HNO 3 rain Particles Particles VOC Heavy metals CO SO 2 NO x CO 2 Industries Heatings Vegetation Biogenics growth Human and Traffic animal health EFFECTS SOURCES
The problems due to the atmospheric pollution are more and more complex 1. The physical and chemical processes are non-linear 2. The socio-economical problems are global
September 12: 16h00 O over ATHENS 3 Geostrophical wind 60 Thr Lyk Pen Lio Ele Mar Per NRo Pat Dem Ren 40 LyH Geo Spa Pir [km] NSm September 14: 16h00 Hel 20 Aig Geostrophical wind 20 60 40 [km] Photosmog > 90 ppb Photosmog <90ppb
Social Pressures Technical Feasibility Decision Choice of strategies Environmental Impacts Economical Developments Pollutant Distributions Complex physical and chemical processes Emission Distributions Human Activities Technical Innovations Air Quality Management
600 Gross World Product Vehicle Fleet Fossil Energy Consumption 500 Population 400 Index (1950=100) 300 200 100 0 1950 1960 1970 1980 1990 Years World Trends
Emissions Sources in Switzerland Repartition of the Anthropic Emissions Natural and Anthropic Emissions
EmissionsEvolution Emissions SO2 120 Industries Household 100 Transport 80 Agriculture and forest Ton’s per year 60 NOX Emissions 180 Transport Objectives for the Emission Reduction (level of 1950) 40 160 Industries 140 Agriculture 20 and forests 120 Household 0 100 VOC Emissions (without the methane) 1900 1920 1940 1960 1980 2000 Ton’s per year 350 Industries 80 Objectives for the Emission Reduction (level of 1960) Transport 300 60 Household 250 40 Agriculture 20 and forests 200 Ton’s per year 0 1900 1920 1940 1960 1980 2000 150 Objectives for the Emission Reduction (level of 1960) 100 50 0 1900 1920 1940 1960 1980 2000
Freight Transport in Switzerland 300 Air Road 250 Gross National Product Train 200 (1970=100) Air Private Vehicles 150 Train Index 100 50 0 1970 1974 1978 1982 1986 1990 1994 Evolution of the Transport Energy Consumption in the Swiss Transport 180 160 140 120 100 Terajoules per year 80 60 40 20 1976 1978 1980 1982 1984 1986 1988 1990 1992 1994 1995 1970 1972 1974
Reduction Strategies • Objectives: Long term strategy (target values) Alert strategy (threshold values). • Means: Incite to renew the technologies: - the fuels, - the material (vehicles, industrial equipments) Improve the transport management : - truck vs. rail, - public transport, - car pool, - road traffic fluidity, - reduce the vehicles circulation.
Causes Phenomenon Effects Output Model Input
Ozone in ppb Ozone in ppb 92 65 Wind 82 110 90 115 90 115 130 122 Emissions ? 65 82 94 110 122 94 130 120 ? SolarRadiation Solar Radiation Methods based on Data collected in the Past
Deterministic Methods Causes Phenomenon Effects Emi. Atmospheric Physics and Chemistry Pollutant Conc. Meteo Terrain Output Model Input
65 82 110 120 90 90 115 130 122 65 82 94 110 122 94 130 120 ? Ozone in ppb Ozone in ppb 92 Wind Emissions 120 Solar Radiation SolarRadiation