Download
1 / 72
720 likes | 866 Views
Chapter 21. The Nucleus: A Chemist’s View. Chapter 21: The Nucleus: A Chemists View. 21.1 Nuclear Stability and Radioactive Decay 21.2 The Kinetics of radioactive Decay 21.3 Nuclear Transformations 21.4 Detection and Uses of Radioactivity 21.5 Thermodynamic Stability

E N D
Chapter 21 The Nucleus: A Chemist’s View
Chapter 21: The Nucleus: A Chemists View 21.1 Nuclear Stability and Radioactive Decay 21.2 The Kinetics of radioactive Decay 21.3 Nuclear Transformations 21.4 Detection and Uses of Radioactivity 21.5 Thermodynamic Stability 21.6 Nuclear Fission and Nuclear Fusion 21.7 Effects of Radiation
Subatomic particle tracks in a bubble charger at CERN, the European particle physics laboratory in Geneva, Switzerland. Source: CERN, Geneva, Switzerland
DISTRIBUTION OF STABLE NUCLIDES • Protons Neutrons Stable Nuclides % • Even Even 168 60.2 • Even Odd 57 20.4 • Odd Even 50 17.9 • Odd Odd 4 1.4 Total = 279 99.9% (like table 21.1 , P 980)
PROPERTIES OF FUNDAMENTAL PARTICLES • Particle Symbol Charge Mass • (x10 -19 Coulombs) (x10-27kg) • Proton P +1.60218 1.672623 • Neutron N 0 1.674929 • Electron e -1.60218 0.0005486
NUCLEAR STABILITYModes of Radioactive Decay • Alpha Decay - Heavy Isotopes - 42He+2- • Beta Decay - Neutron Rich Isotopes - e -- • Positron Emission -Proton Rich Isotopes - • Electron Capture - Proton Rich Isotopes • x - rays • Gamma-ray emission( - Decay of nuclear • excited states • Spontaneous Fission - Very Heavy Isotopes
Comparison of Chemical and Nuclear Reactions Chemical Reactions Nuclear Reactions 1. One substance is converted to 1. Atoms of one element typically another,but atoms never change change into atoms of another. identity. 2. Orbital electrons are involved as 2. Protons, neutrons, and other bonds break and form; nuclear particles are involved; orbital particles do not take part. electrons take part. 3. Reactions are accompanied by 3.Reactions are accompanied by relatively small changes in energy relatively large changes in and no measurable changes in mass. energy and often measurable changes in mass. 4. Reaction rates are influenced by 4. Reaction rates are affected by temperature, concentration, number of nuclei, but not by catalysts, and the nature of the temperature, catalysts, or the chemical substance. nature of the chemical substance.
Emission and Absorption of Light by Atoms Light Light Light Nucleus of atom Electron Light Emission occurs when an electron drops from a higher energy level to a lower one. Light Absorption by an atom moves an electron to a higher energy level.
Absorption and Emission of Light by The Nucleus Excited state Ground state Protons and Neutrons in the nucleus are moved up to excited states by the absorption of large amounts of energy, and they move from excited states back to the ground states by the emission of large amounts of energy! This energy is normally 106 times larger than the energy emitted by electron transfers around atoms, and is in the Gamma ray region of the electromagnetic spectrum.
Figure 12.1: Electromagnetic radiation has oscillating electric (E) and magnetic (H) fields in planes perpendicular to each other and to the direction of propagation.
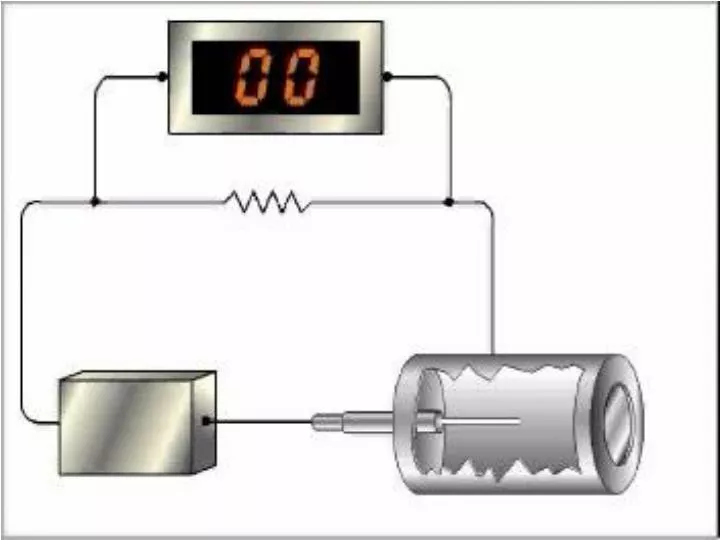
Figure 21.7: Schematic representation of a Geiger-Muller counter
Alpha Decay -Heavy Elements • 238U234Th + + E T1/ 2= 4.48 x 10 9 yrs • 210Po 206Pb + + E T 1/ 2= 138 days • 256Rf 252No + + E T1/ 2= 7 msec • 241Am 237Np + + E T1/ 2= 433 days
Beta Decay - Electron Emission • N P+ + + Energy • 90Sr 90Y + + Energy T1/ 2= 30 yrs • 14C 14N + + Energy T1/ 2= 5730 yrs • 247Am 247Cm + + Energy T1/ 2= 22 min • 131I 131Xe + + Energy T1/ 2 = 8 days
Electron Capture - Positron Emission P+ + e - n + Energy = Electron Capture P+ n + e+ + Energy = Positron Emission 51Cr + e - 51V + Energy T1/2 = 28 days 7Be 7Li + + Energy T1/2 = 53 days 177Pt + e - 177Ir + Energy T1/2 = 11 sec 144Gd 144Eu + + Energy T1/2 = 4.5 min
Gamma Ray Emission, the Nuclear Particles in the Nucleus dropping from excited states to their ground states. Example is the decay of cobalt – 60 to excited states in nickel – 60, which then decay to the ground state of 60Ni. Beta decay, e- 60Co 2.405 Mev 1.173 Mev Gamma ray 1.332 Mev 1.332 Mev Gamma ray Ground state of 60Ni
Natural Decay Series of Existing Isotopes 40K 40Ar T1/2 = 1.29 x 10⁹yrs 232 Th 208 Pb T1/2 = 1.4 x 10¹⁰yrs 235U 207 Pb T1/2 = 7 x 10⁸yrs 238U 206 Pb T1/2 = 4.5 x 10⁹yrs
Natural Decay series for Uranium 238 238U234 Th 234Pa 234U 230 Th 226Ra 222Rn 218Po 214Pb 218At 214Bi 210 Tl 214Po 210Pb 206Hg = decay 210Bi 206Tl = decay 210 Po206Pb 238U -- 8decays and 6 decays leaves you with -- 206Pb
Natural Decay series for Uranium 235 235U231 Th 231Pa 227Ac 223Fr 219At 215Bi 227 Th 223Ra 219Ra 215Po 211Pb 215At 211Bi 207 Tl 211Po207Pb = decay = decay 235U -- 8 decays and 4 decays leaves you with -- 207Pb
Natural Decay series for Thorium 232 232 Th228Ra 228Ac 228 Th 224Ra 220Rn 216Po 212Pb 212Bi 208Tl 212Po 208Pb = decay = decay 232 Th -- 7 decays and 4 decays leaves you with -- 208Pb
Figure 21.3: The decay of a 10.0 -g sample of strontium-90 over time.
Figure 21.4: change in the amount of Molybdenum - 99 with time
Physicist works with a small cyclotron at the University of California at Berkeley. Source: Corbis
CERN, the world's largest particle accelerator, lies at the foot of the Jura Mountains near Geneva, Switzerland.
Accelerator tunnel at Fermilab, a high-energy particle accelerator in Batavia, Illinois. Source: Fermilab Batavia, IL
Carbon-14 radioactivity is often used to date human skeletons found at archaeological sites Source: University of Pennsylvania Photo Archives
Figure 21.8: Consumption of Na131I Normal Thyroid An Enlarged Thyroid Source: Visuals Unlimited
Figure 21.9: Binding energy per nucleon as a function of mass number.
Units used for Nuclear Energy Calculations electron volt - (ev) The energy an electron acquires when it moves through a potential difference of one volt: 1 ev = 1.602 x 10⁻¹⁹J Binding energies are commonly expressed in units of megaelectron volts (Mev) 1 Mev = 106 ev = 1.602 x 10 -13J A particularly useful factor converts a given mass defect in atomic mass units to its energy equivalent in electron volts: 1 amu = 931.5 x 10⁶ ev = 931.5 Mev
Binding Energy per Nucleon of Deuterium Deuterium has a mass of 2.01410178 amu. Hydrogen atom = 1 x 1.007825 amu = 1.007825 amu Neutrons = 1 x 1.008665 amu = 1.008665 amu 2.016490 amu Mass difference = Theoretical mass - actual mass = 2.016490 amu - 2.01410178 amu = 0.002388 amu Calculating the binding energy per nucleon: Binding Energy -0.002388 amu x 931.5 Mev / amu Nucleon 2 nucleons = Mev / nucleon =
Calculation of the Binding Energy per Nucleon for Iron- 56 The mass of Iron -56 is 55.934939 amu, it contains 26 protons and 30 Neutrons Theoretical Mass of Fe - 56 : Hydrogen atom mass = 26 x 1.007825 amu = 26.203450 amu Neutron mass = 30 x 1.008665 amu = 30.259950 amu 56.463400 amu Mass defect =Actual mass - Theoretical mass: 55.934939 amu - 56.463400 amu = - 0.528461 amu Calculating the binding energy per nucleon: Binding Energy - 0.528461 amu x 931.5 Mev / amu nucleon 56 nucleons = = Mev / nucleon
Calculation of the Binding Energy per Nucleon for Uranium - 238 The actual mass of Uranium - 238 = 238.050785 amu, and it has 92 protons and 146 neutrons Theoretical mass of Uranium 238: Hydrogen atom mass = 92 x 1.007825 amu = 92.719900 amu neutron mass = 146 x 1.008665 amu = 147.265090 amu 239.98499 amu Mass defect = Actual mass - Theoretical mass: 238.050785 amu - 239.98499 amu = - 1.934205 amu Calculating the Binding Energy per nucleon: Binding Energy -1.934205 amu x 931.5 Mev / amu mucleon 238 nucleons = = Mev / nucleon
Mass and Energy in Nuclear Decay - I Consider the alpha decay of 212Po T1/2 = 0.3 s 212Po 208Pb + + Energy 211.988842 g/mol 207.976627 g/mol + 4.00151 g/mol Products = 207.976627 + 4.00151 = 211.97814 g/mol Mass = Po - Pb + = 211.988842 211.97814 0.01070 g/mol E = mC2 = (1.070 x 10⁻⁵ kg/mol)(3.00 x 108m/s)2 = 9.63 x 10¹¹ J/mol 9.63 x 10¹¹ J/mol 6.022 x 10²³ atoms/mol = ____________________ J/atom
Mass and Energy in Nuclear Decay - II The Energy for the Decay of 212Po is 1.60 x 10⁻¹²J/atom 1.60 x 10⁻¹²J/atom 1.602 x 10⁻¹⁹ J/ev = 1.00 x 10⁷ ev/atom 10.0 x 10⁶ ev 1.0 x 10⁻⁶ Mev atom ev x = 10.0 Mev/atom !!!!! The decay energy of the alpha particle from 212Po is = 8.8 Mev !!!!
Figure 21.10: Both fission and fusion produce more stable nuclides and are thus exothermic.
Figure 21.11: Upon capturing a neutron, the 235U nucleus undergoes fission to produce two lighter nuclides, free neutrons (typically three), anda large amount of energy.
Figure 21.12: Representation of a fission process in which each event produces two neutrons, which can go on to split other nuclei, leading to a self-sustaining chain reaction.
Figure 21.13: If the mass of the fissionable material is too small, most of the neutrons escape before causing another fission event; thus the process dies out.