Download

1 / 27
270 likes | 459 Views
Recent IPCC findings: Working Group III - Mitigation. Focus on the FSU&CEE +. November 19, 2007 Budapest. Aleksandra Novikova Dr. Diana Ü rge-Vorsatz. Outline. Emission trends Adapt or mitigate? Co-benefits of mitigation Potentials for mitigation Policies: are they really expensive?

E N D
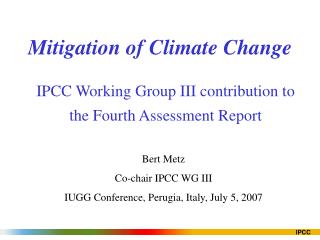
Recent IPCC findings: Working Group III - Mitigation.Focus on the FSU&CEE + November 19, 2007 Budapest Aleksandra Novikova Dr. Diana Ürge-Vorsatz
Outline • Emission trends • Adapt or mitigate? • Co-benefits of mitigation • Potentials for mitigation • Policies: are they really expensive? • Conclusions
Emission trends • GHG emissions grew with an increase of 70% in 1970 – 2004 • The effect of declining energy intensity has been smaller than the combined effect of per capita income growth and population growth
Where are we going to? • The SRES (non-mitigation) scenarios project an increase of baseline global GHG emissions by 25 - 90% between 2000 and 2030
Time-sensitive issue: Adapt or mitigate? • Can be complementary, substitutable or independent of each other • Adaptation measures are required anyway • Over the next 20 years or so, aggressive climate policy can do little to avoid warming already ‘loaded’ into the climate system • Over longer time frames, mitigation investments have a greater potential to avoid climate change damage • This potential is larger than the adaptation options that can currently be envisaged • Two-pronged strategy: avoid the unmanageable (mitigation) and manage the unavoidable (adaptation) (Source: Urge-Vorsatz. 2007. Presentation of the UN SEG Report)
The costs of GHG mitigation • In 2030 macro-economic costs for multi-gas mitigation, consistent with emissions trajectories towards stabilization between 445 and 710 ppm CO2-eq, are estimated at between a 3% decrease of global GDP and a small increase, compared to the baseline
Why climate mitigation policies? • Health co-benefits from reduced air pollution as a result of actions to reduce GHG emissions may offset a substantial fraction of mitigation costs • Other numerical co-benefits co-benefits • Improved energy security • Employment creation and new business opportunities • Growing real estate values • Reduced urban congestion • Increased access to energy services for the poor • Improvements in industrial productivity and competitiveness • The environmental issues • Case study of Hungary • Reduced energy poverty • Reduced bankruptcy among households • Relieved social tensions related to energy pricing • The value of these co-benefits often outweigh the direct financial benefits of energy savings
Sectoral economic potential for global mitigation for different regions as a function of carbon price, 2030
Estimated potential for GHG mitigation at a sectoral level in 2030 in different cost categories , transition economies Source: constructed based on the IPCC (2007)
Three key pillars of mitigation strategies • Lowering the energy intensityof economic activity through increases in the efficiency of vehicles, buildings, appliances, and industrial processes • Lowering the carbon-emissions intensity of energy supply through additions of renewable and nuclear energy supply and through modifications to fossil fuel technologies that enable the capture and sequestration of CO2 • Reducing the carbon emissions from land-use change by means of reforestation, afforestation, avoided deforestation, and improved soil-management practices in agriculture Source: Urge-Vorsatz. 2007. Presentation of the UN SEG Report
Introduction of policy tools to improve efficiency: expensive? Examples of policy tools in the buildings sector
Is there a silver bullet? • No one policy can capture the large share of the potential • Policy packages needed! • Effective combinations of policy instruments • Ex: Standards, labeling and financial incentives Source: CLASP, 2004
Early investment are important! Table 11.17:Observed and estimated lifetimes of major GHG-related capital stock
Conclusion • GHG are expected to continue growing dramatically • Mitigation and adaptation policies should be integrated • The macro-economic costs of mitigation to stay under 4 °C of the T- increase above the pre-industrial level is between a 3% decrease of global GDP and a small increase, compared to the baseline • Co-benefits of efficiency improvement and mitigation pay back these costs with additional revenues on the top • Mitigation opportunities are available in each sector, the largest cost-effective potential (29% of the baseline in 2020) is in buildings • There are many good examples of energy-efficiency and mitigation policies designed worldwide • The number of these policies is cost-effective! • No single instrument can capture the large share of the low-cost mitigation potential • A portfolio of instruments is necessary • Early actions are important!
Thank you for your attention! Novikova Aleksanda Email: novikovaa@ceu.hu Dr. Diana Ürge-Vorsatz http://www.ceu.hu/envsci/staffDV.htm Email: vorsatzd@ceu.hu Note: all graphics and figures are from the IPCC WG III, 2007 if not stated otherwise.
Selected sectoral policies that have shown to be environmentally effective in at least a number of national cases Source: SPM
Overview of the global emissions for the year 2004, the baseline emissions for all GHGs adopted for the year 2030 (in GtCO2-eq). Source: chapter 11, AR 4 IPCC
Emission Reduction by Technology AreaACT Map Scenario in the ETP by IEA Improved energy efficiency most important contributor to reduced emissions AGENCE INTERNATIONALE DE L’ENERGIE INTERNATIONAL ENERGY AGENCY
Cumulative emission reductions for alternative mitigation measures for 2000–2030 and for 2000–2100 • Different stabilization scenarios reflect different contribution of mitigation measures • Scenarios concur that 60-80% of reductions should come from energy and industry Illustrative scenarios from AIM, IMAGE, IPAC and MESSAGE aiming at the stabilization at 490–540 ppm CO2-eq (light bars) and at 650 ppm CO2-eq (dark bars) Source: WG III Technical Summary, Figure TS.10
Conclusion: The impact and effectiveness of various policy instruments
The impact and effectiveness of various policy instruments Part 1: Control and regulatory mechanisms
The impact and effectiveness of various policy instruments Part 2: Economic and market-bases instruments Notes: Country name abbreviations (according to the ISO codes except California, Ontario, Central and Eastern Europe and European Union): DZ – Algeria, AR – Argentina, AU – Australia, AT – Austria, BE – Belgium, BR – Brazil, CL – California, CA – Canada, CEE – Central and Eastern Europe, CN – China, CR – Costa Rica, CZ – Czech Republic, DE – Germany, Denmark – DK, EC – Ecuador, EG – Egypt, EU – European Union, FI – Finland, FR – France, GB – United Kingdom, HK – Hong Kong, HU – Hungary, IN – India, IE – Ireland, IT – Italy, JP – Japan, KR – Korea (South), MX – Mexico, NL – Netherlands, NO – Norway, ON – Ontario, NZ – New Zealand, NG – Nigeria, PH – Philippines, PO – Poland, SG – Singapore, SK – Slovakia, SI – Slovenia, CH – Switzerland, SE – Sweden, TH – Thailand, US – United States.
The impact and effectiveness of various policy instruments Part 3: Financial instruments and incentives Notes: please see the references for assessment of each policy tool in Chapter 6 of the IPCC AR4
The impact and effectiveness of various policy instruments Part 4: Support, information and voluntary action