How do we represent the position specific preference ?
G: 5 -> 71% S: 1 -> 14 % C: 1 -> 14 %. Basic concept of motif identification 2. How do we represent the position specific preference ?. BID_MOUSE I A R H L A Q I G D E M BAD_MOUSE Y G R E L R R M S D E F BAK_MOUSE V G R Q L A L I G D D I

How do we represent the position specific preference ?
E N D
Presentation Transcript
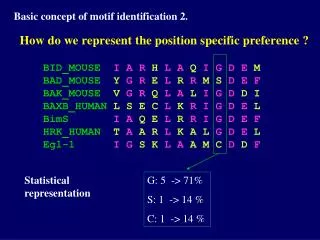
G: 5 -> 71% S: 1 -> 14 % C: 1 -> 14 % Basic concept of motif identification 2. How do we represent the position specific preference ? BID_MOUSEI A R H L A Q I G D E M BAD_MOUSE Y G R E L R R M S D E F BAK_MOUSE V G R Q L A L I G D D I BAXB_HUMAN L S E C L K R I G D E L BimS I A Q E L R R I G D E F HRK_HUMAN T A A R L K A L G D E L Egl-1 I G S K L A A M C D D F Statistical representation
Practice: identify potential transcription factor binding sites on a promoter sequence. Using TESS : Transcription Element Search System http://www.cbil.upenn.edu/cgi-bin/tess/tess33?RQ=WELCOME
Why there are many false positives for TF binding site scan? • Contextual dependency is not considered. • Stringency of the matrices.
A A C C G G T T Consensus Consensus 4 40 13 0 23 13 23 0 N G 20 5 3 0 70 12 5 0 G G 15 55 3 0 40 2 0 0 R A 0 0 93 17 0 0 5 0 C C 53 17 8 0 8 0 30 0 W A 15 0 0 0 3 0 82 17 T T 0 0 0 0 100 17 0 0 G G 0 0 50 13 0 0 50 4 Y C 0 0 68 17 0 0 30 0 C C 0 12 35 17 3 0 48 0 Y C 0 0 17 0 G 0 0 17 0 G 2 0 15 0 G 0 17 0 0 C 17 0 0 0 A 0 0 0 17 T 0 0 17 0 G 0 2 0 15 T 0 13 0 4 C 0 7 2 7 Y Consensus –20 bp Stringency of the matrices Consensus –10 bp P53_01 P53_02
DNA Pattern – Transcription factor binding site • Pattern strings / Matrixes are extracted from known binding sequence. • Core vs whole. • Some short and/or ambiguous patterns will have many hits.
Sequence logo 2.0 Information content 1.0
Comparing genomes • For understanding genome organization. • For identifying functionally conserved region / sequences. • 3’, 5’ UTR (eg. microRNA binding sites) • Transcription factor binding sites / regulatory modules.
Vista Genome Browser Practice & Observe: cross genome comparison using vista browser
Identifying conserved regulatory modules • Regulatory module: a set of TF binding sites that controls a particular aspects of transcriptional regulation. • Functional requirement conservation at the binding site (sequence) level.
Ways to Identify conserved regulatory modules • Based on sequence similarity: • MEME, • rVista, Whole genome rVista for model organisms • … • Based on binding site identity: • BLISS
Practice: Identifying conserved TF binding sites using rVista 1.) Search for your gene in Whole genome rVista. Or 2.) Compile corresponding genomic region from different species (can be >2). Load to rVista. This can be used for identifying shared regulatory modules in related genes in the same organism as well.
rVista Practice & Observe: Load genomic sequences from Human, Rat, and Opossum to rVista. Choose TF matrices (e.g. E2F, P53, ATF, etc)
Representation of Deep Seq data Chrom. Start End name Scor Strand chr2L 10000192 10000217 U0 0 + chr2L 10000227 10000252 U1 0 - chr2R10000310 10000335 U2 0 + chr3L 10000496 10000521 U1 0 - chr2110000556 10000581 U2 0 +
Representation of Deep Seq data • The importance of reference genome • All coordinates are only meaningful for a given genome assembly. • One assembly may have multiple releases (annotations).
Manipulating Deep Seq data with Galaxy Practice & Observe: Load the PolII.H99.Bed file to Galaxy with the Get Data tool. Sort data based on chromosome location c2. Filter out lines with U0 with the expression c4!=‘U2’
Visualizing Deep Seq data with UCSC genome browser Practice & Observe I: Load the PolII.H99.Bed file as custom track to the browser by copy/past the URL link. View ‘dense’ and then ‘full’ presentation of the track.
Visualizing Deep Seq data with UCSC genome browser Practice & Observe II: Save the landmark.bed file to your local computer. View the contents with Notepad. Load the local file to UCSC browser. Edit the color value, save, resubmit, and observe the differences.
Apollo Genome annotation tools Observe: Using Apollo to organize information for studying complex genomic regions.