Download
1 / 24
240 likes | 380 Views
The Status of Argo: Achievements and Future Evolution. Dean Roemmich , Scripps Institution of Oceanography Susan Wijffels, CSIRO/Centre for Australian Weather and Climate Research Co-Chairs, Argo Steering Team PI-GOOS, Wellington N.Z. February 2012. Outline.

E N D
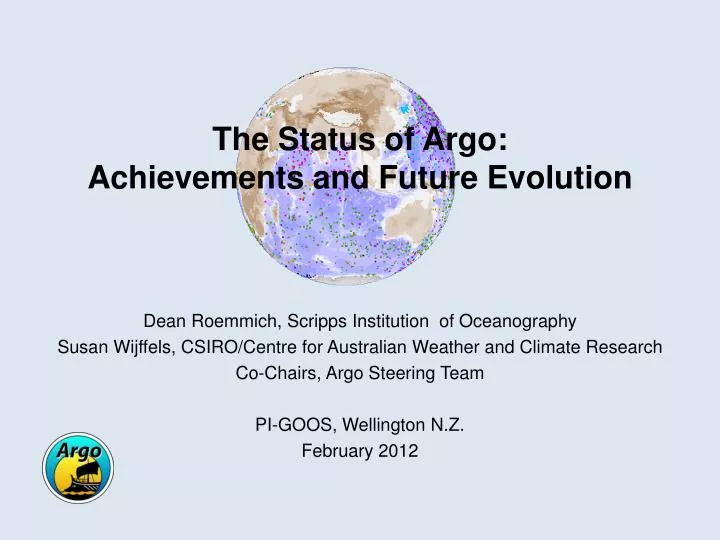
The Status of Argo: Achievements and Future Evolution Dean Roemmich, Scripps Institution of Oceanography Susan Wijffels, CSIRO/Centre for Australian Weather and Climate Research Co-Chairs, Argo Steering Team PI-GOOS, Wellington N.Z. February 2012
Outline • What has Argo achieved relative to its initial objectives? • What are the remaining challenges? • What are the uses of Argo data? • How will Argo expand for new objectives?
How do Argo floats work? Illustration of a float cycle: Floats collect a temperature and salinity profile every 10 days, with data returned by satellite and made available within 24 hours via the GTS and internet (http://www.argo.net) . Salinity Temperature Cost of an Argo T,S profile is < $200 (all-inclusive). Cost of a WOCE profile was ~$12,000. Map of float trajectory Temperature/Salinity relation
Argo: the original vision and reality The 1999 Argo Design 3300 randomly distributed floats at 3o x 3o average spacing. Argo: the real thing And it took only 10 years from concept to 3000 float implementation.
How has Argo changed global oceanography? • Argo is a revolutionary advance: • In data quantity. • In data distribution. • In data accessibility. Before floats, subsurface ocean data could only be collected by a ship or a fixed-point mooring. All August research vessel Temperature/Salinity profiles (> 1000 m, 1951 - 2000). Pre-Argo August Before Argo Argo August The Argo era 5 years of August Argo T,S profiles (2007-2011).
Key to success: making the technology work! Collaboration with manufacturers and investment in technical teams has resulted in a great improvement in float lifetimes, now exceeding the ambitious goals set when Argo started of 3-4 year lifetimes profiling every 10 days (~100 profiles). Out of 750 floats deployed in 2007, 394 remain active (53%) after 4.5 years (averaging 133 cycles per float so far).
Key to success: strong international co-operation The Argo Steering Team has responsibility to harmonize national contributions to create a uniform global array with uniform data quality and open availability.
Global coverage at design density achieved around 2007/2008 The wrong way to deploy a float
Data management Argo profiles at global data centers as of Jan 2012. DM = delayed mode. Total profiles: 894912Delayed-mode: 626206 • Stability and accuracy of salinity • Completeness, DMQC, timeliness. • Identification and documentation of problems After 100 cycles, nearly 90% have adjustment < 0.01 psu. Instrument pressure biases in Argo have now been tracked and removed.
Research applications of Argo - climate • Heat and freshwater storage • Water mass formation and characteristics • Ocean circulation and transport • Mesoscale to large-scale ocean dynamics http://www.argo.ucsd.edu/Bibliography.html Papers per year Research papers using Argo data Southern Hemisphere Northern Hemisphere Global average temperature 0 – 2000 m Global mean temperature, 0 – 2000 m. Mean dynamic height of the sea surface. Winter mixed layer salinity and depth
Science Ambitions?At the start of Argo, the Science Team described “The Principal Achievements of a Decade of Argo”*: • Obtain an unprecedented dataset for model initialization and data assimilation … • Enable operational real-time global ocean forecasting... • Produce an accurate global climatology, with error bars and statistics of variability… • Produce accurate time-series of heat and freshwater storage... • Provide large-scale constraints for atmospheric model-derived surface heat and freshwater fluxes… • Complete the global description of the mean and variability of large-scale ocean circulation… • Determine the dominant patterns and evolution of interannual variability in temperature and salinity… • Provide global maps of the absolute height of the sea surface… • Enable the interpretation of (altimetric) sea surface height… • Directly interpret sea surface height anomalies…. After the first 5 years with a global array, all of these are well advanced. * AST-1 Meeting Report: http://www.argo.ucsd.edu/iast1.pdf
Operational applications of Argo • About 15 operational centers around the world use Argo data for: • Ocean state estimation. • Short-term forecasting. • Seasonal-to-interannual prediction. • Decadal climate prediction. • See: http://www.argo.ucsd.edu/FrUse_by_Operational.html http://www.cpc.noaa.gov/products/GODAS/ NOAA CPC Global Ocean Data Assimilation System: Argo is the dominant data source.
Education and outreach applications of Argo • Education programs using Argo data are being developed in many nations (e.g. SEREAD) • Education/outreach tools: The Global Marine Atlas was created for easy interactive display of data: http://www.argo.ucsd.edu/Marine_Atlas.html . • Argo layer in Google Earth.ftp://ftp.jcommops.org/Argo/TMP/Google/kmz_ocean_data.kmz Below: Exploring the 2009/2010 El Niño with the Global Marine Atlas Steric Niño 3.4 temperature anomaly
How will Argo expand for new objectives? Incremental expansions: • High latitudes and marginal seas (already begun). • Improved surface layer sampling. • Enhanced vertical resolution. • Active array management. Major expansions: • Deep ocean profiling. • Multidisciplinary sensors. • Boundary currents. Via 2-way high bandwidth communications Over 10% of the array is now returning high resolution profiles using high-band-width satellite communications
Issues for sustaining Argo: PI-GOOS • Sustainability of RV Kaharoa deployment cruises is in doubt due to escalating costs and constant funding. • High priority to communicate with Pacific Island nations the need forglobal ocean observations of climate variability and change, and the benefits from the information being obtained (e.g. climate assessments, research, education, …). • Critical to sustain agreements (initially established via SOPAC and its member nations) on float deployments inside regional EEZs. • Lack of continuity in PI-GOOS coordination has been a problem. Maintaining good communication with both SPREP and SPC/SOPAC will be a challenge. Nearly 1000 floats deployed by RV Kaharoa since 2004. Argo coverage in the Pacific is good.
Issues for expanding Argo: • Expansions should not go forward without proportional new resources (inmanpower, including data management, and floats). • Argo’s evolution must maximize the value of the integrated ocean/climate observing system. How can this best proceed (i.e. for Argo and gliders, Deep Argo and repeat hydrography)? • Additional sensors beyond T,S increase EEZ sensitivities and reduce chances for international consensus on global deployment. • Deep Argo and Multi-sensor Argo both present challenging technology development problems. • Deep Argo may be resource-limited (cost per profile? ). • Multi-sensor Argo may be manpower limited (complex data challenge). Argo floats with oxygen, bio-optical, and nitrate sensors
Summary • Argo has achieved many of its original goals. • New technologies are improving float capabilities and data quality. • Argo has had an enormous impact on research; the dataset is among the most-used in oceanography. • There are strong challenges for sustaining and improving the core Argo Program. • Major expansions to Argo (Deep Argo; Biogeochemical Argo; WBC enhancement) will require adequate resourcing. • Thanks to: Argo Steering Team, Argo Data Management Team, contributing nations and agencies, and many key participants. http://www.argo.net
Issues for sustaining Argo: • Argo data policy (immediate public release of all data) applied to multi-sensor floats and Argo-equivalent floats is creating an unfunded burden in data management. • Argo’s open data policy encourages hasty publication. The maturation time for best quality data is years • A global Argo float deployment strategy is needed that includes resources for dedicated vessel time. • A strong continuing focus is needed on (i) technology improvement and (ii) data management, to reduce systematic errors in pressure and salinity (for global change studies) and to avoid or identify major technical failures. • The lack of an international agreement on Argo float deployment in EEZs is resulting in coverage shortfalls near some coastlines. Location over 980 Argo floats deployed by New Zealand’s RV Kaharoa since 2004 for US and Australian Argo
135 Years of Global Ocean Warming from the Challenger Expedition to the Argo Program* *D. Roemmich, W.J. Gould, and J. Gilson, Accepted byNature Climate Change
Centennial change: Argo and Challenger Voyage of HMS Challenger 1872-1876 Challenger temperature section, New York-St Thomas (Worthington 1976) In the first global oceanographic expedition, HMS Challenger obtained ~300 temperature profiles, 1872 – 1876, using pressure-protected min/max thermometers. Since Argo measures temperature everywhere, we have profiles of “Argo-minus-Challenger” temperature difference for all Challenger stations (except those with a Tmin, e.g. high latitude Southern Ocean). Challenger-to-Argo is the maximum time interval possible (> 130 years) for the instrumental record of (subsurface) ocean temperature change. Min/max protected thermometer from HMS Challenger (Fig from Tait, 1881)
Argo – Challenger SST Mean 0.59oC 0.13 Above: Argo-minus-Challenger SST difference (red(+)/blue(-), tenths oC), seasonally-corrected. Means are Pacific:Atlantic area-weighted. Left: NOAA OI Reconstructed SST shows about 0.5oC of warming between the Challenger and Argo eras. The Argo-minus-Challenger SST difference is consistent with the historical SST record. Black: NOAA Reconstructed SST, 1-yr running mean Red: 5-yr running mean Blue: Argo, 1-yr running mean
The ΔT pattern (mostly) decreases with depth. The Atlantic warmed more than the Pacific. 200 fathoms Mean 0.39oC 0.21 Systematic errors in Challenger T 1) Effect of pressure on glass protected thermometers (0.04°C km-1). Tait (1881) 2) Depth estimated from measured line out (warm bias of unknown amount). 3) Pressure heating of vulcanite thermometer mountings (probably small – Tait, 1881) Other errors: Parallax in reading thermometers. Index jarring loose. 500 fathoms Mean 0.12oC 0.08
The 0 – 700 m (weighted) average ΔT is 0.33 °C ± 0.14, double the estimated value for the past 50 years (Levitus et al, 2009, 0.17 °C). Similarly, for the Atlantic we find the 0 – 700 m ΔT is 0.58 °C ± 0.20 compared to 0.30 °C for Levitus et al, 2009, and for the Pacific 0.22 °C ± 0.20 compared to 0.12 °C. This implies that the global warming seen in the Argo-minus-Challenger comparison occurred on centennial timescale, beginning at least as long ago as the late 19th or early 20th century. Net Argo-minus-Challenger heat gain, 0-1500 m is 1.3 x 10⁹ J m-2, or an average of 0.3 W m-2 over the 135-year interval. The existence of systematic (warm) errors in the Challenger data mean these estimates are a lower bound on the heat gain. 0.59 °C ± 0.12 0.39 °C ± 0.18 0.12 °C ± 0.07 Error bars: 1 s.e.; 1 degree of freedom per 3 stations based on integral scale Black: Simple average of Argo-minus-Challenger ΔT. Red: Weighted by Pacific : Atlantic area ratio. Blue: Weighted, and with Tait’s (1881) pressure-correction. Over a long period of time, a small trend becomes a large difference.
Summary • The Argo Program provides a global dataset of more than 100,000 high-quality CTD profiles per year, 0 – 2000 m. • A wide variety of basic research* uses the Argo dataset to investigate mesoscale to global variability during the Argo era. • Argo is a key dataset for global change studies , providing for the first time a fixed-era climatology for the upper ocean. • The coming decade will see Argo extended into the deep ocean, marginal and coastal seas, and seasonal ice zones, and including new biogeochemical sensors. * 4th Argo Science Workshop to be held Sept 27-29 in Venice, alongside “20 Years of Progress in Radar Altimetry”. See http:/www.altimetry2012.org