Download
1 / 41
410 likes | 538 Views
Genetic evaluation using combined data from all breeds and crossbred cows. Jersey Holstein. USDA Yearbook of Agriculture 1947. From USDA research herd at Beltsville, MD. Red Dane Jersey. USDA Yearbook of Agriculture 1947.

E N D
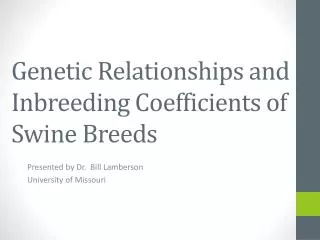
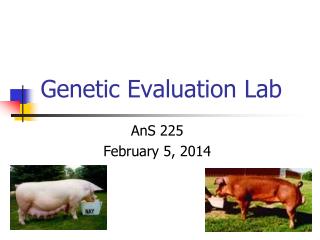
Genetic evaluation using combined data from all breeds and crossbred cows
Jersey Holstein USDA Yearbook of Agriculture 1947 From USDA research herd at Beltsville, MD
Red Dane Jersey USDA Yearbook of Agriculture 1947 Crossbreds averaged 12,904 pounds of milk and 588 pounds of butterfat, outperforming dams by more than sire proof predictions (Fohrman,1947). Advanced register Holsteins averaged 13,833 pounds of milk and 493 pounds of fat in 1945.
Goals • Evaluate crossbred animals without biasing purebred evaluations • Accurately estimate breed differences • Compare crossbreeding strategies • Compute national evaluations and examine changes • Display results without confusion
All-Breed Analyses • Crossbred animals • Will have PTAs, only 3% did before if in breed association grading-up programs • Reliable PTAs from both parents • Purebred animals • Information from crossbred relatives • More herdmates (other breeds, crossbreds) • Routinely used in other populations • New Zealand (1994), Netherlands (1997) • USA goats (1989), calving ease (2005)
Methods • All-breed animal model • Purebreds and crossbreds together • Relationship matrix among all • Unknown parents grouped by breed • Variance adjustments by breed • Age adjust to 36 months, not mature • Within-breed-of-sire model examined but not used
Data • Numbers of cows of all breeds • 22.6 million for milk and fat • 16.1 million for protein • 22.5 million for productive life • 19.9 million for daughter pregnancy rate • 10.5 million for somatic cell score • Type traits are still collected and evaluated in separate breed files
Number of Cows with Records(with > 50% heterosis; March 2007)
Number of Cows with Records(with > 50% heterosis; March 2007)
Crossbred Daughters Addedfor sires in top 10 NM$ within breed
Breed Effects and Heterosis • Three estimates of breed differences: • From phenotypic breed differences • From herds containing crossbred cows • From all-breed model using all data • All three estimates were similar • Estimates of general heterosis from 2001 and 2003 studies were used in the current research and not re-estimated
Unknown Parent Groups • Look up PTAs of known parents • Estimate averages for unknowns • Group unknown parents by • Birth year • Breed • Path (dams of cows, sires of cows, parents of bulls) • Origin (domestic vs other countries)
Display of PTAs • Genetic base • Convert all-breed base to within-breed bases (or vice versa) • PTAbrd = (PTAall – meanbrd) SDbrd/SDHO • PTAall = PTAbrd (SDHO/SDbrd) + meanbrd • Heterosis and inbreeding • Both effects removed in the animal model • Heterosis added to crossbred animal PTA • Expected Future Inbreeding (EFI) and merit differ with mate breed
EBV differences from Holstein estimated from an all-breed model
Phenotypic breed differences from Holstein from an all-breed model
EBV differences from Holstein estimated from an all-breed model
Phenotypic breed differences from Holstein from an all-breed model
Net Merit Relative EmphasisIn cooperation with Dr. Tony Seykora et al. DPR = daughter pregnancy rate (fertility), CA$ is index of calving ease and stillbirth
NM$, FM$, CM$ Economic Values Other values are same in each index: PL 29, SCS -150, Size -14, Udder 28, F&L 13, DPR 21, CA$ 1
Other Trait Estimates • Calving ease and stillbirth estimated from breed means • 7.3 million HO, 37000 JE, 17000 BS, 2000 GU, 2000 AY, 300 MS • Body size composite estimated from mature weight • Udder composite, Feet / Leg composite extrapolated from regressions on other traits within Holsteins • Size, PL, milk, DPR, SCS
Correlations used in Predictions Canada now scores linear conformation traits of all breeds on the same scale
Assumed Effects – Other TraitsTransmitting ability differences from Holstein
Merit of F1 Holstein Crossbreds Compared to 2005 genetic base for Holstein
Later Generation Crosses Compared to 2005 genetic base for Holstein
Three-Breed Crosses USDA Yearbook of Agriculture 1947 Butterfat yield of three breed crosses was greater than from their F1 crossbred dams. Three breed crosses averaged 14,927 pounds of milk and 641 pounds of butterfat as 2-year-olds in 1947.
Scandinavian and French Breeds • AIPL has pedigree records for other breeds (NR, SR, MO); but few production records yet • For further information: • Interbull conversions to Ayrshire base • U. Minnesota scientists (Heins et al.)
Conclusions (1) • All-breed model accounts for: • Breed effects and general heterosis • Unequal variances within breed • May 2007 implementation expected • PTA converted back to within-breed bases, crossbreds to breed of sire • PTA changes larger in breeds with fewer animals
Conclusions (2) • Breed effects were estimated • Yield, PL, SCS, DPR by all-breed model • Calving ease and stillbirth breed means • Udder, F&L composites from other traits • Lifetime Net Merit formula for August 2006 applied • Holsteins still superior for FM$
Conclusions (3) • BS x HO and JE x HO crosses had higher NM$ and CM$ than HO • BS x JE had higher CM$ than HO • Three-breed crosses (HO, BS, JE) are higher than HO backcrosses for CM$, similar for NM$ • Use best bulls within each breed
Acknowledgments • Several others at AIPL contributed greatly to this project, including Mel Tooker, George Wiggans, John Cole, Jay Megonigal, and Ashley Sanders