Understanding Menu Types and Their Impact on Restaurant Operations
This guide explores various types of menus used in the restaurant industry, including Standard, Daily, Cycle, and Specials. Each menu type is analyzed for its benefits and drawbacks, such as the simplification of the ordering process versus challenges in adjusting to food cost increases. It highlights how menu design can influence customer choices, emphasizing the importance of presentation, pricing strategies, and the psychological impact on diners. With insights into effective menu forecasting and inventory management, this resource is essential for restaurant managers.

Understanding Menu Types and Their Impact on Restaurant Operations
E N D
Presentation Transcript
Standard Menu • Is printed and remains virtually constant • It simplifies ordering process, gives guests a number of choices, and allows managers to easily obtain guests peference data. Drawbacks: • Ineffective carryover of products • Difficulty adjusting to sudden food cost increases.
Types of Menus • Daily Menu • Cycle Menu • Menu Specials • Standard Menu
Daily Menu • Changes everyday • Allows management to respond to changes in the price of raw materials needed to produce menu items • Encourages the creative re-use of carryovers. Drawbacks: • Problems with forecasting new items and difficulties in ordering ingredients on short notice.
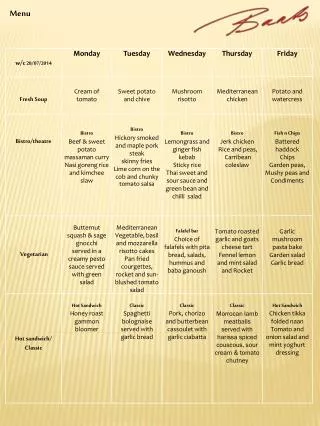
Cycle Menu • Changes after a specific period of time. • Popular with operations where guests dine regularly. • Often appearing in 7-day, 21-day, or 30-day cycles, • Give greater variety to guests and offer a more systematic approach to food production process.
Menu Specials • Provide minor variations for guests • Reduce waste by using up carryovers • Take advantage of low-cost raw ingredients • enable managers to test market new items
Converting Standard Recipes • Yield: # of servings produced based on a stated portion size. • Conversion: to change a recipe from one yield to another
Menu Descriptions • Shows all ingredients, portion size, and size & count in a dish on 1 piece of paper or poster. • Plating: is how a an items is served including garnish, sauce & arrangement
Menu Description Functions • Illustrates a menu item so that it matches a standardized recipe • Shows the volume of item on a plate • Displays special presentation considerations. • Allows staff to see the distinction b/w different size portions • SOP: standard operating procedure based on a menu item. • FOH: explains ingredients especially if allergic.
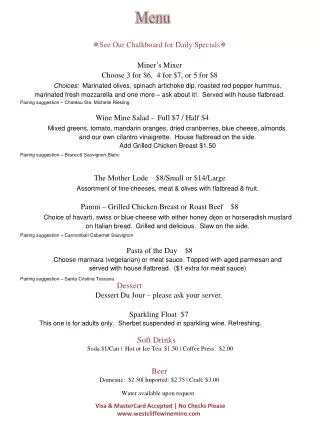
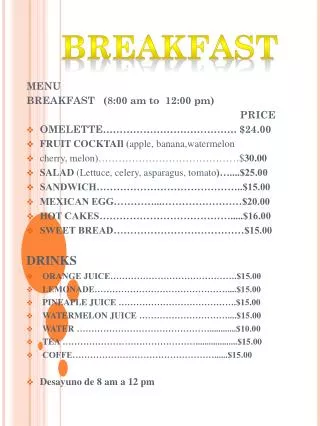
Menu provides a list of food items available by selection by a customer & sales tool. TYPES: Spoken Menu: Menu that is presented by someone orally. Table d’hote: Several food items grouped together an sold for one price. A la carte: Food items priced individually. Room Service: Call for items ready to eat delivered to rooms. Menu Presentation
Menu Psychology The design of the menu can have a subtle effect on what customers will eventually order. • most customers will spend an avg. of 109 sec. reading a menu. • 60 percent to 70 percent of their sales came from fewer than 18-24 menu items. • Reduce menu items • Ex: 50-100 different choices. Not only did they shorten the order-taking time, they reduced inventory & purchases.
Eye Gaze Motion • The eye will travel in a set pattern when viewing a menu • People do not read a menu page to page • Guests scan the menu • Use eye magnets to draw attention. • Ex: e place a box around the appetizers or font & color changes.
Font Style • Increase the size of font to attract the customer’s attention to an item • Decrease the size to deflect attraction from an item. • Avoid fonts that are difficult to read, especially in dim lighting.
Menu Psychology Primacy & Recency: Position menu items that you want to sell more in the 1st & last positions within a category as the 1st & last things a customer reads. • = more likely to be chosen
Menu Forecasting • To minimize running out of food ingredients as well as to avoid excessive food leftovers.
Menu Pricing • Is tied to the reality that as the price of a menu item increases, the # of items sold will generally decrease. • Pricing should always establish a positive price/value relationship in the mind of the guest.
Factors Influencing Menu Pricing • Local Competition • Service Levels • Guest Type • Product Quality • Portion Size • Ambience • Meal Period • Location • Sales Mix
Product Cost Percentage Method placing high value on the direct relationship of cost to selling price for each item Formula 1: Selling price = Cost of a specific food item sold/ Desired food cost % of item. Formula 2: Pricing factor = 1.00 / Desired Product Cost %; Selling price of item = Pricing factor (x) Product cost
Product contribution Margin • Method seeks to find the contribution margin of each product, or the amount left over from an item’s selling price once its cost has been subtracted. • The average contribution margin per item is more important that its food cost % Formula: Selling Price of Item = Product cost (+) Contribution Margin Desired
Special Pricing Situations • Coupons: reduce sales revenue with the hope that the total # of guests increase where total revenue increases. • Value Pricing: all or most menu prices are reduced with the hope that total guest counts will increase where total revenue increases. • Bundling: takes several menu items and creates a group meal price that is lower than the price of individual items added together.
Buffet Use an ABC inventory approach: • Limit the amount of: • high-cost items 20% • Mid –cost items 30% • Low-cost menu items 50%
Buffets Continued Record beginning and ending amounts and any additions during the serving period to arrive at accurate total food costs. Formula: Per-person cost = Total buffet product cost / guests served Formula: Per-person price= Per-person cost(-)pricing factor
Popularity Index WHAT: Helps managers make good decisions about the quantity of each item that should be prepared. Find Dish/Item Popularity Formula: (/) total # of each menu item sold = Popularity Total # of all menu items sold Index Predict # of items to be sold Formula: (x) Popularity index (x) number of guests expected Note: Additional factors affect this calculation; List below:
Purchase Point Is the point at which an item should be reordered. Operations use both as neededand the par level methods of procuring ingredients. As Needed: Method of inventory determined by ordering the minimum amount of ingredients at any time. Many perishable items are ordered this way. Par level: Inventory Method sets predetermined minimum and maximum amounts that need to be in stock. When ingredients are low (below par level) the buyer knows to place a purchase order. Shelf stable ingredients use this method of control.
Daily Inventory Sheets Allows managers to quickly determine what items need to be ordered. Sheet Includes: • A list of all items ordered. • Typical unit of purchase • Par values for all items Order Amount Formula: Par Value – Items on Hand + special orders= order amount
Cost of Goods Sold Is the dollar amount of all the food actually sold, thrown away, wasted or stolen in a given time period. • By accounting for changes in food inventory over time, cost of food sold provides managers with more accurate food cost figure than simply adding up all food expenses in the same time period. Cost of Goods Sold Formula: Beginning Inventory (+) Purchases (-) Ending Inventory (–)Employee Meals
Cost of Goods Sold Formula: Beginning Inventory (+) Purchases (-) Ending Inventory (–)Employee Meals
Analyzing Food Cost % Is way to look at expenses. Represents the portion of food sales that was spent on food expenses. Formula: Cost of goods sold / Food Sales
Inventory Control Methods 1.Physical Inventory: physical count, valuation of supplies on hand at each accounting period. 2.Perpetual Inventory: which entire inventory is counted and recorded on bin cards; additions to and deletions are recorded on these cards.
ABC Inventory System Grades inventory items according to their monetary value, highlights where inventory attention is needed most. To calculate the A, B, C categories, an operation must: • Calculate monthly usage in units of each inventory item • Multiply total usage of units by purchase price to arrive at the total monthly dollar value of product usage • Rank items from highest $ amount to lowest usage. Category A: • 70-80% Category B: • 10-15% Category C: • 5-10%
Homework • Design a Menu for your facility • Include type, prices and descriptions. • Due week 8