Download
1 / 11
110 likes | 132 Views
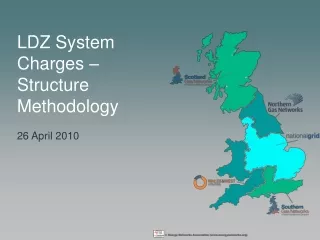
LDZ System Charges – Structure Methodology 26 April 2010. LDZ System Charging Structure. LDZ System Charge Structure was last reviewed in PC68 - 2001 (following earlier consultations PC59 - 2000, and PC38 - 1999)

E N D
LDZ System Charging Structure • LDZ System Charge Structure was last reviewed in PC68 - 2001 (following earlier consultations PC59 - 2000, and PC38 - 1999) • The Methodology defines the relative difference in Unit Charge depending on load size. • Resulting LDZ System Charges: • Three charge bands used • Separate functions for direct loads and CSEPs • CSEP Maximum SOQ used instead of nominated SOQ for deriving Unit Charge • Band Direct Loads CSEPs • 0 - 73.2 MWh/a Fixed unit rate Same unit rate • 73.2- 732 MWh/a Fixed unit rate Same unit rate • >732 MWh/a Power function Different power function • The purpose of this presentation is to provide an understanding to how the methodology was developed and implications for future review.
Methodology Steps • Underlying principle that the LDZ charging methodology reflects the typical use of the network made by customers of a given size, rather than the actual use made by a particular supply point. • Gas flows from Transmission to end consumer in a directional flow through the Distribution pressure systems and through larger to smaller mains.
Methodology Steps • Distribution networks comprise four over-lapping pressure systems: • Local Transmission System (LTS) • Intermediate Pressure System (IPS) • Medium Pressure System (MPS) • Low Pressure System (LPS) • The LPS is significantly larger than the other networks and accounts for the vast majority of connection points. • The Methodology identifies the likelihood of point of connection by EUC Load band, identifies the usage of upstream systems and apportions the relative cost of systems to loads within EUC Load band • we will take you through an example to help clarify how this operates • A sample is taken to represent the typical supply point characteristics within each EUC Load band – in PC68 this comprised of ~ 3m supply points and iGT survey results for CSEPs.
Methodology Steps – Network Costs • Connection Point Analysis used to identify the profile of connection by EUC Load Bands • Firstly, the LPS network is split into a series of Pipe Diameter groups to establish a more accurate cost reflective breakdown of the total DN network. • Costs for each pressure system and sub-tier were identified using replacement costs and ABC modelling. The cost of each part of the network have been identified in total.
Methodology Steps – Connection Probability • Connection data shows where on average supply points within the Load Band connect onto the network • As expected, the smaller supply points connect typically further downstream to larger supply points. The data is used to split the peak day demand for capacity.
Methodology Steps – Utilisation Probability • In a simplified world all gas leaving the NTS will pass into the LTS, gas flowing to the IPS comes from the LTS, gas flowing into MPS comes from the IPS and all gas entering the LPS comes from the MPS. • In reality the majority of NTS flows into the LTS but some flows directly into the IPS and MPS, likewise the LPS is fed from LTS, IPS and MPS. Consequently, the peak day conditions are used to identify the flows of gas through the systems and reliance of each unit of capacity on a pressure tier on the upstream systems. • This is used to identify the upstream capacity / demand
Methodology Steps – Cost Split by Load Band • The split of revenue targeted from each tier is divided by the total capacity (demand) to identify the fully loaded unit cost • e.g. MPS: £35.3m / 807.5GWh = 4.38p/pdkWh • The Load Band usage of the tier is used to identify the per unit of capacity cost For 0-73.2MWh/a 94.4%gas passes through the MPS, 94.4% of 4.38= 4.13p/pdkWh/a • The total Load Band unit cost is identified by summing the tier costs
Methodology Steps – Unit Charges • The total unit costs per unit of capacity (demand) is plotted to identify any trends and derive a function for the charges.
Updating the LDZ System Methodology • PC68 used national costs and a national sample • Since 2005 charges have reflected network specific allowed revenues and recent changes in Methodology have sought to reflect both common changes in cost reflectivity (capacity / commodity splits) and differences in cost structures (DNPC05 – LDZ System vs Customer revenue apportionment). • From DNPC05 it is clear that each network has different costs • DNs are updating the methodology (using the same process – not changing the principle of the methodology) on a network specific basis • Samples have been taken for each network. These comprise 100% of LTS, IPS, MPS connected supply points and samples representing (95% confidence interval) for each Load Band connected to the LPS. Samples taken for directly connected (almost 15% of all directly connected loads) and CSEPs (over 50% of all CSEPs).
Updating the LDZ System Methodology • Costs based on DNPC05 analysis and allocations consistent with PC68 where appropriate (assets) and better allocation used where identified. • Likely to result in differing structures for each network in order to be as cost-reflective as possible i.e. LDZ System charges may have a different profile over Load Bands in different networks • Potentially different Charge bands for each network • Possibly use more or less than 3 charge bands • 0-73.2MWh/a charge band will be retained but possibly different start and end points for other charge bands • All unit rates for >73.2MWh/a bands likely to be function-based rather than fixed rates as for 73.2-732MWh at present • Possibly different function types by network i.e. logs in some and power in others • Review whether separate CSEP functions are still appropriate • Retain use of Maximum SOQ for CSEP Unit Charge calculation