Download
1 / 22
220 likes | 499 Views
Profit maximization by firms. ECO61 Udayan Roy Fall 2008. Revenues and costs. A firm’s costs (C) were discussed in the previous chapter A firm’s revenue is R = P Q

E N D
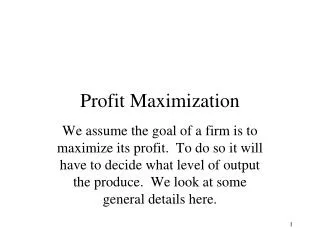
Profit maximization by firms ECO61 Udayan Roy Fall 2008
Revenues and costs • A firm’s costs (C) were discussed in the previous chapter • A firm’s revenue is R = P Q • Where P is the price charged by the firm for the commodity it sells and Q is the quantity of the firm’s output that people buy • We discussed the link between price and quantity consumed – the demand curve – earlier • Now it is time to bring revenues and costs together to study a firm’s behavior
Profit-MaximizingPrices and Quantities • A firm’s profit, P, is equal to its revenue R less its cost C • P = R – C • We assume that a firm’s actions are aimed at maximizing profit • Maximizing profit is another example of finding a best choice by balancing benefits and costs • Benefit of selling output is firm’s revenue, R(Q) = P(Q)Q • Cost of selling that quantity is the firm’s cost of production, C(Q) • Overall, • P = R(Q) – C(Q) = P(Q)Q – C(Q) 9-3
Profit-Maximization: An Example • Noah and Naomi face weekly inverse demand function P(Q) = 200-Q for their garden benches • Weekly cost function is C(Q)=Q2 • Suppose they produce in batches of 10 • To maximize profit, they need to find the production level with the greatest difference between revenue and cost 9-4
Profit-Maximization: An Example Note that [50 – Q]2 is always a positive number. Therefore, to maximize profit one must minimize [50 – Q]2. Therefore, to maximize profit, Noah and Naomi must produce Q = 50 units. This is their profit-maximizing output. When Q = 50, π = 2 502 = 5000. this is the biggest profit Noah and Naomi can achieve.
Choice requires balance at the margin • In general marginal benefit must equal marginal cost at a decision-maker’s best choice whenever a small increase or decrease in her action is possible
Marginal Revenue • Here the firm’s marginal benefit is its marginal revenue: the extra revenue produced by the DQ marginal units sold, measured on a per unit basis 9-9
Marginal Revenue and Price • An increase in sales quantity (DQ) changes revenue in two ways: • Firm sells DQ additional units of output, each at a price of P(Q). This is the output expansion effect: PDQ • Firm also has to lower price as dictated by the demand curve; reduces revenue earned from the original Q units of output. This is the price reduction effect: QDP 9-10
Figure 9.4: Marginal Revenue and Price Price reduction effect of output expansion: QP. Non-existent when demand is horizontal Output expansion effect: PQ 9-11
Marginal Revenue and Price • The output expansion effect is PDQ • The price reduction effect is QDP • Therefore the additional revenue per unit of additional output is MR = (PDQ + QDP)/DQ = P + QDP/DQ • When demand is negatively sloped, DP/DQ < 0. So, MR < P. • When demand is horizontal, DP/DQ = 0. So, MR = P. 9-12
Profit-Maximizing Sales Quantity • Two-step procedure for finding the profit-maximizing sales quantity • Step 1: Quantity Rule • Identify positive sales quantities at which MR=MC • If more than one, find one with highest P • Step 2: Shut-Down Rule • Check whether the quantity from Step 1 yields higher profit than shutting down 9-14
Profit • Profit equals total revenue minus total costs. • Profit = R – C • Profit/Q = R/Q – C/Q • Profit = (R/Q - C/Q) Q • Profit = (PQ/Q - C/Q) Q • Profit = (P - AC) Q
Marginal cost Profit-maximizing price E B profit Average cost Average D C cost Demand Marginal revenue QMAX Profit: downward-sloping demand of price-setting firm Costs and Revenue Quantity 0
Profit: downward-sloping demand of price-setting firm • Recall that profit = (P - AC) Q • Therefore, the firm will stay in business as long as price (P) is greater than average cost (AC).
Average total cost Demand Shut down because P < AC at all Q:downward-sloping demand of price-setting firm Costs and Revenue Quantity 0
The firm maximizes profit by producing the quantity at which MC marginal cost equals marginal revenue. MC 2 AC = = = = P MR MR P AR MR 1 2 MC 1 Q Q Q 1 MAX 2 Profit Maximization: horizontal demand for a price taking firm Costs and Revenue Quantity 0
MC AC Shut down because P < AC at all Q: horizontal demand for a price taking firm Costs and Revenue ACmin = = P AR MR Quantity 0
Supply Decisions • Price takers are firms that can sell as much as they want at some price P but nothing at any higher price • Face a perfectly horizontal demand curve • not subject to the price reduction effect • Firms in perfectly competitive markets, e.g. • MR = P for price takers • Use P=MC in the quantity rule to find the profit-maximizing sales quantity for a price-taking firm • Shut-Down Rule: • If P>ACmin, the best positive sales quantity maximizes profit. • If P<ACmin, shutting down maximizes profit. • If P=ACmin, then both shutting down and the best positive sales quantity yield zero profit, which is the best the firm can do. 9-21
Price determination • We have seen how the price is determined in the case of price setting firms that have downward sloping demand curves • But how is the price that price taking firms use to guide their production determined? • For now think of it as determined by trial and error. Pick a random price. See what quantity is demanded by buyers and what quantity is supplied by producers. Keep trying different prices whenever the two quantities are unequal • The market equilibrium price is the price at which the quantities supplied and demanded are equal