Part 5
110 likes | 128 Views
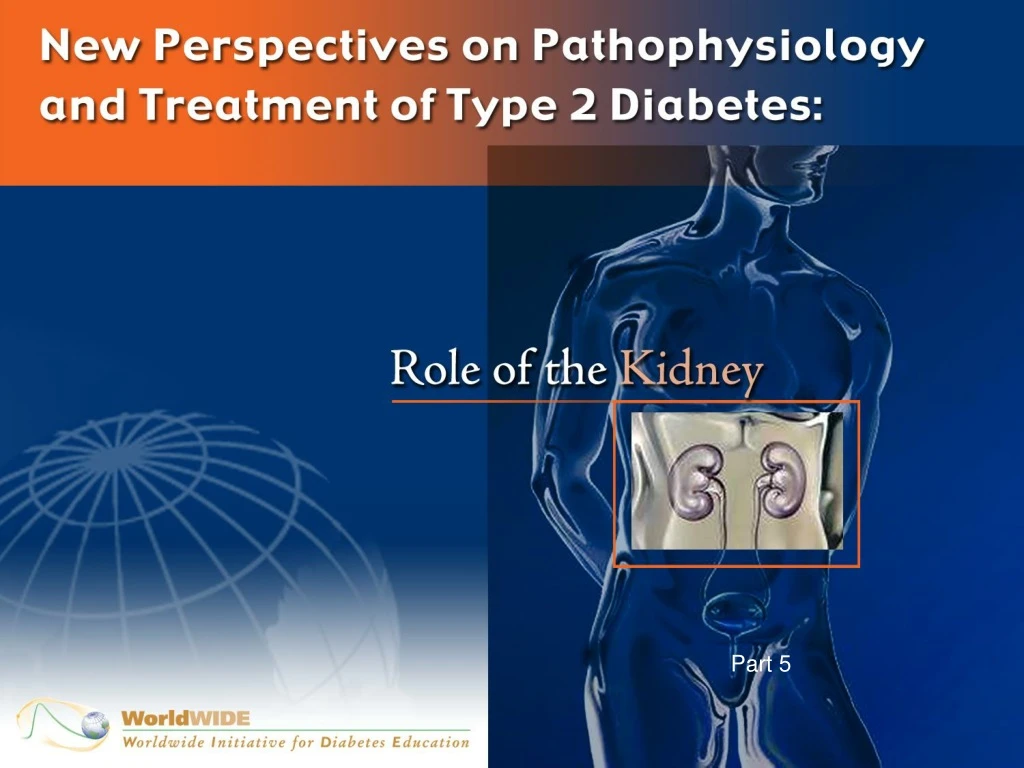
Part 5. Insulin Resistance and -Cell Dysfunction: Summary. Individuals with impaired glucose tolerance Are maximally or near-maximally insulin resistant Have lost ~80% of their -cell function Have an incidence of diabetic retinopathy of ~10%. Pathogenesis of Diabetes. Evolving Concepts.

Part 5
E N D
Presentation Transcript
Insulin Resistance and -CellDysfunction: Summary • Individuals with impaired glucose tolerance • Are maximally or near-maximally insulin resistant • Have lost ~80% of their -cell function • Have an incidence of diabetic retinopathy of ~10%
Pathogenesis of Diabetes Evolving Concepts
Pathogenesis of Type 2 Diabetes Impaired Insulin Secretion Islet b-cell Increased HGP Decreased Glucose Uptake HGP=hepatic glucose production.
Pathogenesis of Type 2 Diabetes Diabetes Normal glucose tolerance Diabetes Normal glucose tolerance Insulin Secretion Impaired Insulin Secretion 1st Phase 2nd Phase -10 -5 0 5 10 15 20 25 30 35 40 45 50 55 60 65 70 75 80 85 90 95 100 Time (minutes) i.v.Glucose Insulin Secretion 1st Phase 2nd Phase Islet b-cell Increased HGP -10 -5 0 5 10 15 20 25 30 35 40 45 50 55 60 65 70 75 80 85 90 95 100 Time (minutes) i.v.Glucose Decreased Glucose Uptake Adapted from Weyer C, et al. J Clin Invest. 1999;104:784-789; Ward WK, et al. Diabetes Care. 1984;7:491-502. HGP=hepatic glucose production.
Pathogenesis of Type 2 Diabetes Impaired Insulin Secretion Islet b-cell Increased HGP Decreased Glucose Uptake
Pathogenesis of Type 2 Diabetes Control Control 4.0 4.0 T2DM T2DM 3.5 3.5 Impaired Insulin Secretion r=0.85P<0.001 r = 0.85P<0.001 Basal HGP(mg/kg • min) Basal HGP(mg/kg• min) 3.0 3.0 2.5 2.5 2.0 2.0 Islet b-cell Increased HGP 100 200 300 100 200 300 FPG (mg/dL) FPG (mg/dL) Decreased Glucose Uptake DeFronzo RA, et al. Metabolism. 1989;38:387-395.
Pathogenesis of Type 2 Diabetes Impaired Insulin Secretion Islet b-cell Increased HGP Decreased Glucose Uptake
The Disharmonious Quartet Impaired Insulin Secretion ↑ FFA Increased Lipolysis Islet b-cell Increased HGP Decreased Glucose Uptake FFA=free fatty acids.
Role of Free Fatty Acids Hyperglycemia Increased Lipolysis Lipolysis Plasma FFA Muscle Liver FACoA FACoA Gluconeogenesis Glucose Utilization HGP HGP FACoA=FFA-derived long-chain acyl-CoA esters. Boden G. ProcAssoc Am Physicians. 1999;111:241-248.
Free Fatty Acids Impair -Cell Function Hyperglycemic Clamp Procedure in NGT Individuals With Positive Family History of T2DM Δ C-peptide Concentration (%)* P<0.04 P<0.001 First Phase Second Phase *Percent difference between lipid infusion and saline infusionin subjects with family history of T2DM. Kashyap S, et al. Diabetes. 2003;52:2461-2474.