Download

1 / 27
270 likes | 526 Views
Basics of Credit Analysis 信贷风险分析基础. Alexandru Cebotari. Sources and Types of Risks 风险来源及种类. A firm should continually monitor each of these and other type of risks 公司必须持续监控以上各种及其他类型的风险 A loan officers task is to understand how a firm monitors its risks 信贷员的任务是了解公司是如何掌控其所面临的风险的;

E N D
Basics of Credit Analysis信贷风险分析基础 Alexandru Cebotari
A firm should continually monitor each of these and other type of risks • 公司必须持续监控以上各种及其他类型的风险 • A loan officers task is to understand how a firm monitors its risks • 信贷员的任务是了解公司是如何掌控其所面临的风险的; • Analysis of the financial consequences of these elements of risk using financial statements is an important tool • 通过财务报表分析这些风险带来的财务影响是一种重要的方法; • Various financial reporting standards require firms to discuss in notes to financial statements how important elements of risk affect a particular firm and the actions it takes to manage its risks • 不同的财务报告准则都要求公司在财务报表附注中披露各种风险对公司的影响程度以及公司为控制这些风险所采取的行动; • In addition to using information about risk disclosed in the notes to financial statements, loan officers typically assess the dimensions of risk using ratios of various items in the financial statements • 除了使用报表附注中已经披露的信息以外,信贷员还可以根据报表中不同科目的比例来衡量风险程度。
Profitability, Growth, Risk 盈利能力,增长率,风险 Product-Market Strategies 产品策略 Financial-Market Strategies 财务策略 Operating Decisions 经营决策 Financing Decisions 财务决策 Dividend Decisions 股利政策 Investment and Asset Management Decisions 投资和资产管理决策 Managing Revenue & Expenses 收入及费用控制 Managing Working Capital & Fixed Assets 经营资金及固定资产管理 Managing Liabilities and Equity 负债及权益管理 Managing Dividend Payout 股利支付管理 Profit Margin Ratios 利润率 Efficiency Ratios 效率比率 Capital Structure Ratios 资本结构 Payout Ratios 股利支付比例
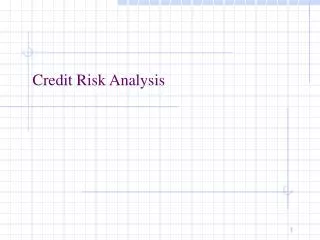
Most financial statement-based risk analysis focuses on a comparison of the supply of cash and demand for cash • 通常财务报表风险分析关注现金的供求比 • Risk analysis using financial statement data typically examines • 财务报表风险分析主要考察的风险有: • (1) short-term liquidity risk, the near term ability to generate cash to service working capital needs and debt service requirements, and • (1) 短期流动风险,即短期内现金流入满足经营现金需要及偿还债务的能力 • (2) long-term solvency risk, the longer-term ability to generate cash internally or from external sources to satisfy plant capacity and debt repayment needs • (2)长期流动风险,即长期现金产出或外部融资满足经营所需及偿还债务的能力 • The field of finance identifies two types of risks: • 财务风险有两种: • (1) credit risk, a firm’s ability to make payments on interest and principle payments, and • (1) 信用风险,即企业偿还利息和本金的能力 • (2) bankruptcy risk, the likelihood that a firm will be liquidated • (2) 破产风险,即企业面临破产的可能性
Framework for Financial Statement Analysis of Risk财务报表风险分析架构
Analysis of Short-Term Liquidity Risk短期流动性风险分析 • The analysis of short-term liquidity risk requires an understanding of the operating cycle of a firm! • 短期流动性风险分析需要了解一家企业的经营过程 • Current Ratio: mainly used to give an idea about the company’s ability to pay back its short-term liabilities and a sense of the efficiency of the firm’s operating cycle and its ability to turn its products into cash (ratio ≥ 1.0 preferred) • 流动比率:主要用于分析公司短期偿债能力,经营效率及变现能力(比率应大于等于1.0) • Quick Ratio: known as acid test, measures the firm’s ability to pay off its short-term debt from current liquid assets; draws a more realistic picture (trend towards 0.5) • 速动比率:也叫酸性测试,考量企业用速动资产偿还短期债务的能力,比流动比率更真实(接近0.5) • Operating Cash Flow Ratio: using cash flow as opposed to accounting items provides a better indication of liquidity (40%ntypical of a healthy firm) • 营运现金流动比率:使用实际的现金流量比科目余额更好的衡量企业流动性(良好的企业的比率通常为40%) • Short-term liquidity problems also arise from longer-term solvency difficulties! • 长期流动性困难也会导致短期流动性问题
Analysis of Long-Term Solvency Risk长期偿债能力风险分析 • Increasing the proportion of debt in the financial structure intensifies the risk that the firm cannot pay interest and repay the principle on the amount borrowed • 增加债务在资本结构中的比例会增加企业无法到期还本付息的风险 • Analysis of long-term solvency risk must begin with an analysis of short-term liquidity risk • 长期偿债能力风险分析必须从短期流动性风险分析出发 • Firms must survive in the short-term if they are to survive in the long-term! • 企业必须在短期经营中生存才能够在长期经营中生存 • Interest Coverage Ratio: gives a sense of how far earnings can fall before a firm will start defaulting on its payments (risky if ≤ 2.0) • 已获利息倍数:表示企业盈利对需要支付利息的保障(如果小于等于2就存在风险) • Long-Term Debt to Long-Term Capital Ratio: way of looking at the debt structure and determine what portion of total capitalization is comprised of long-term debt (what if ≥ 1?) • 长期债务/长期资本比率:衡量总资本中长期债务所占的比例(如果大于等于1,说明什么?)
经营现金流量分析 1)销售现金比例 2)总资产现金比例 3)净资产现金比例 4)总负债现金比例 净利润分析 1)销售净利率 2)总资产净利率 3)净资产净利率 4)总负债净利率 资产负债率分析 1)流动负债总资产率 2)长期负债总资产率 3)总负债总资产率 4)总负债优先股总资产率 流动资产总资产率分析 1)现金总资产比 2)速动资产总资产比 3)流动资产总资产比 4)经营现金总资产比 流动资产流动负债率分析 1)现金流动负债比 2)速动资产流动负债比 3)流动资产流动负债比 周转率分析 1)现金周转率 2)应收帐款周转率 3)存货周转率 4)速动资产周转率 5)流动资产周转率 6)经营现金周转率 7)净资产周转率 8)总资产周转率 9)现金区间 (现金/经营现金支出) 10) 防御区间 (防御性资产/经营现金支出) 11)无信贷间隔天数 (防御性资产-流动债务)/经营现金支出 破产预测模型 附注:经营现金流量=净利润+折旧+损耗+摊销;净资产=所有者权益+递延税项资产;现金=现金+可出售债券;经营现金=流动资产-流动负债;经营现金支出=经营支出-折旧-损耗-摊销;防御性资产=速动资产。
Univariate Analysis单变量分析 The six ratios with the best discriminating power (and the nature of the risk each ratio measures) were as follows: 六个主要的变量及所衡量的风险如下: • Net Income plus Depreciation, Depletion, and Amortization/Total Liabilities (long-term solvency risk) • (净收入+折旧+损耗+摊销)/总负债 长期流动性风险 • Net Income/Total Assets (profitability) • 净收入/总资产 盈利能力 • Total Debt/total Assets (long-term solvency risk) • 总负债/总资产 长期偿债能力风险 • Net Working Capital/Total Assets (short-term liquidity risk) • 净经营现金/总资产 短期流动性风险 • Current Assets/Current Liabilities (short-term liquidity risk) • 流动资产/流动负债 短期流动性风险 • Cash, Marketable Securities, Accounts Receivable/Operating Expenses excluding Depreciation, Depletion and Amortization (short-term liquidity risk) • (现金+可出售证券+应收帐款)/(除去折旧、损耗、摊销的经营费用) 短期流动性风险
Multivariate Bankruptcy Prediction Models多变量预测模型 Altman’s Z-Score:(Altman’s Z-积分模型)
Multivariate Bankruptcy Prediction Models多变量预测模型 • We can convert the Z-score into a probability of bankruptcy using the normal density function within Excel. The formula is: =NORMSDIST(1-Z score). Altman developed this model so that higher positive Z-scores mean lower probability of bankruptcy. • 我们可以用Excel的功能将Z-score变成企业破产的概率。公式是=NORMSDIST*(1-Z-score)。Altman的模型指出Z-score为正数且越大,企业破产的概率越低。 • The principle strengths of MDA are as follows: • 多变量模型的优点在于 • It incorporates multiple financial ratios; • 它综合了多个财务指标 • It provides the appropriate coefficients for combining the independent variables; • 它给每个独立的变量合适的系数 • It is easy to apply once the initial model has been developed. • 当最初的模型更新时仍可以方便的使用
Each ratio captures a different dimension of profitability or risk: 每个指标都包含着不同程度的风险 • Net Working Capital/Total Assets: the proportion of total assets comprising relatively liquid net current assets (current assets minus current liabilities). It is a measure of short-term liquidity risk. • 净经营现金/总资产:净流动资产占总资产的比例,用于衡量短期流动性风险 • Retained Earnings/Total Assets: accumulated profitability. • 累积盈余/总资产:衡量累积盈利能力 • EBIT/Total Assets: this ratio measures current profitability. • 息税前利润/总资产:衡量当期盈利能力 • Market Value of Equity/Book Value of Liabilities: this is a form of debt/equity ratio, but it incorporates the market’s assessment of the value of the firm’s shareholders’ equity. This ratio measures long-term solvency risk and the market’s overall assessment of the profitability and risk of the firm. • 所有者权益市价/负债帐面价值:这是负债/所有者权益比一中形式,但它综合了市场对所有者权益的估值。该指标考量了长期流动性风险和市场对公司盈利能力和风险的总体评估。 • Sales/Total Assets: this ratio is similar to the total assets turnover ratio and indicates the ability of a firm to use assets to generate sales. • 销售收入/总资产:这个指标类似于总资产周转率,表示了企业利用资产的能力。 In applying this model, Altman found that Z-scores of less than 1.81 indicated a high probability of bankruptcy, while Z-scores higher than 3.00 indicates a low probability of bankruptcy. Scores between 1.81 and 3.00 were in the gray area. 运用该模型, Altman发现Z-score小于1.81时,预示企业有很高的破产风险,而当Z-score大于3.00时,预示着较低的破产风险,介于1.81和3.00之间为灰色区域。
Logit Analysis 概率模型 Probability of Bankruptcy of a Firm: 企业的破产概率: y = -1.32 – 0.407*SIZE + 6.03*TLTA – 1.43*WCTA + 0.0757*CLCA – 2.37*NITA – 1.83*FUTL + 0.285*INTWO – 1.72*OENEG – 0.521*CHIN, SIZE = ln (Total Assets/GNP Deflator) 规模= ln (总资产/国民生产总值平减指数) TLTA = Total Liabilities/Total Assets TLTA=总负债/总资产 WCTA = (CA-CL)/Total Assets WCTA=(流动资产-流动负债)/总资产 CLCA = Current Liabilities/Current Assets CLCA= 流动负债/流动资产 NITA = Net Income/Total Assets NITA=净收入/总资产 FUTL = Funds (Working Capital) from Operations/Total Liabilities FUTL=经营现金/总负债 INTWO = one if Net Income (NI) was negative in the last two years and zero otherwise INTWO=如果净收入小于0,即等于1;否则等于0 OENEG = one if owners’ equity is negative and zero otherwise OENEG=如果所有者权益小于0,即等于1;否则等于0 CHIN = [NI (this year) – NI (last year)]/[|NI (this year)| + |NI (last year)|] CHIN =(今年净收入-去年净收入)/(今年净收入+去年净收入)
Earnings Manipulation利润操纵 • Beneish developed a probit model to identify the financial characteristics of firms likely to engage in earnings manipulation • Beneish发明了一种概率模型来考量公司参与利润操纵的财务特征 • Probit converts y into a probability using standardized normal distribution. The command NORMSDIST within Excel, when applied to a particular value of y, converts it to the appropriate probability value • Excel中的NORMSDIST公式可以将一个Y值变成合适的概率值
Beneish’s eight factors and the rationale for their inclusion are as follows:Beneish’s八个因素及理论依据如下:
Profitability Analysis盈利能力分析 The analysis of profitability addresses two broad questions: 盈利能力分析带来以下两个问题: • How much risk economic and strategic factors pose for the operations of a firm, its profitability and long-term solvency ? We use the Rate of Return on Assets (ROA) to answer this question. • 经济及战略因素给企业经营、盈利及长期流动性所带来的风险,我们用资产回报率来回答这个问题。 • Can the firm generate the expected return on the capital invested by the lenders and shareholders without compromising the future of the firm? That is, how much of ROA is left to shareholders (owners) after subtracting the amounts owed to lenders. • 企业是否能在不牺牲企业未来的情况下,达到债务人及股东所期望的回报?也就是在偿还债务人以后留给股东的回报有多少。
Average Median ROA, Profit Margin for ROA, and Assets Turnover for 23 industries for 1990 to 2004
Utilites 电力 Oil&Gas extraction 油气开采 Hotels 宾馆 Petropleum 石油 Paper 造纸业 Printing and publishing 印刷出版业 Personal service 服务业 Amusements 娱乐业 Lumber 伐木业 Food products 食品业 Agricultural 农业 Health service 健康服务业 Metals 金属业 Communications 通讯业 Airlines 航空业 Industrial equipment 工业 Transportation equipment 运输业 Restaurants 餐饮业 Wholesalers-Non Durables 批发-快速消费品 Wholesalers-Durables批发-耐用消费品 Retailing-General Merchandise零售业-普通商品 Retailing-Apparel零售业-服装 Grocery store 杂货店 1999年到2004年23个行业资产回报率,利润率及资产周转率比较(注释)
Economic Factors Affecting the Profit Margin/Assets Turnover Mix经济因素对利润率及资产周转率的影响 利润率 竞争约束 产量约束 资产周转率
Return on Common Shareholders’ Equity (ROCE)普通股股东回报率 Return on Assets 资产回报率 Return to Creditors 债权人回报率 Return to Preferred Shareholders 优先股股东回报率 Return to Common Shareholders 普通股股东回报率 普通股股东回报率=普通股股东利润率*总资产周转率*权益乘数 普通股股东利润率=普通股股东净收入/总收入