Download

1 / 67
670 likes | 956 Views
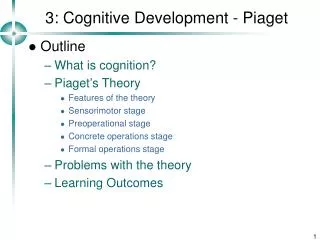
Cognitive Biases 3. HW2 Problem #1. Here are two sequences of coin-flips. X is one side of the coin, O is the other. XXO, for example, means that the coin landed on side X, then side X again, then side O. 1. XXOXXXOXOXOOOXXOOXOO 2. XOXXOXOXOOXXOXOOXOXO

E N D
HW2 Problem #1 Here are two sequences of coin-flips. X is one side of the coin, O is the other. XXO, for example, means that the coin landed on side X, then side X again, then side O. 1. XXOXXXOXOXOOOXXOOXOO 2. XOXXOXOXOOXXOXOOXOXO Which of the two was generated randomly by me flipping a coin, and which is a non-random sequence that I made up? Make sure to tell me how you know the answer.
HW2 Problem #1 Remember that if the sequence is truly random (how the coin lands the second time is independent of how it lands the first time), then the number of times where it lands the same as it did before should be about equal to the number of times where it lands different to what it landed before.
HW2 Problem #1 Let’s color-code “landing the same as the previous toss as blue, and landing different as red. Then sequence #1 is: XXOXXXOXOXOOOXXOOXOO Here we have 8 same tosses and 11 different ones.
HW2 Problem #1 For the second sequence we have: XOXXOXOXOOXXOXOOXOXO This is very different. Here there are only four same tosses and 15 different ones.
HW2 Problem #1 I made up the second sequence. Because I wanted it to look random, I tended to put X’s after O’s and O’s after X’s. This made most of the tosses turn out different– but that’s not what we should expect to happen.
HW2 Problem #2 If I flip a fair coin and ten times in a row it lands heads, which of the following should I most likely expect for the next ten flips? Circle one: A. It will “regress to the mean” and land tails more than heads to balance things out. B. Since it’s a fair coin, it is most likely to land heads half the times and tails the other half.
HW2 Problem #2 The correct answer is B: B. Since it’s a fair coin, it is most likely to land heads half the times and tails the other half. Future tosses of a coin are independent of past ones. Fair coins land, on average, 50% heads and 50% tails.
HW2 Problem #2 Answer A is a trick answer, for several reasons: A. It will “regress to the mean” and land tails more than heads to balance things out.
HW2 Problem #2 Regression to the mean happens when we have two imperfectly correlated variables X and Y, and X takes on a very extreme value. Then we expect Y to take on a less extreme value. But coin flips are not imperfectly correlated. They are not correlated at all. Past coin flips do not influence future coin flips.
HW2 Problem #2 Answer A also contains a misunderstanding about regression. It suggests that if the variable “past coin flips” takes on one extreme value (“lots of heads”) we should expect “future coin flips” to take on an extreme value in the opposite direction (“lots of tails”).
HW2 Problem #2 But this is not how regression works. Even if past and future coin flips are correlated, what we expect is that extreme values of one variable are paired with more average, normal, or “mean” values of the other variable. It’s regression to the mean, not regression to the opposite extreme!
HW2 Problem #3 Suppose that the government conducts a survey of traffic intersections to find out which had the most accidents in the past month. At every intersection where there was a large number of accidents, the government installs cameras. Next month they do a survey again and notice than on average there are fewer accidents at the locations where cameras are installed.
HW2 Problem #3 The government claims: Claim: Installing the cameras reduced the number of accidents. Suppose that this claim is false. Which cognitive bias/ fallacy (that we learned about in class) might be responsible for the government falsely believing the claim, in light of the evidence they have about the reduced number of accidents?
HW2 Problem #3 The answer I am looking for is the regression fallacy. The variables “traffic accidents this month” and “traffic accidents next month” are imperfectly correlated. Intersections with lots of accidents this month will likely have lots next month; intersections with few this month will likely have few next month.
HW2 Problem #3 If you have two imperfectly correlated variables, and one of them (“traffic accidents this month”) takes on an extreme value, the other will have a more moderate value. So the intersections that were the worst this month will be, on average, bad-but-less-bad next month. The will, on average, improve– simply through regression to the mean.
HW2 Problem #3 The regression fallacy is attributing a cause (the cameras the government installed) to an effect (the decrease in accidents at the intersections that had the most accidents last month) that is really just regression to the mean.
HW2 Problem #3 None of this means the cameras didn’t work! To truly test whether cameras work, you must install them at a random sampling of intersections– good and bad ones. If accidents then go down on average, you can be confident the cameras worked. We’ll talk more about random samples later in the course.
HW2 Problem #4 Suppose that I present you with four cards. On each card there is a number on one side and a letter on the other. I claim: Claim: If a card has a vowel on one side then it has an even number on the other side. Which of the four cards do you need to turn over to tell whether this claim is true?
HW2 Problem #4 • Card #1: 6 • Card #2: 7 • Card #3: E • Card #4: F
HW2 Problem #4 Card #1, 6, doesn’t matter. If you turn it over and it has a vowel, then the claim could be true. But it could also be false– maybe some other card has a vowel and an odd number on it. If you turn it over and it does not have a vowel, then the claim again can be either true or false. Card #1 gives you no information.
HW2 Problem #4 Card #4, F, also gives you no information. The claim is about what cards with vowels on one side have on the other side. F is not a vowel, so the claim is not about cards with F’s on one side.
HW2 Problem #4 Card #2, 7, is important. 7 is an odd number. If there is a vowel on the other side of card #2, then the claim is false, because #2 is a card with a vowel on one side but no even number on the other side. You must turn over #2 and make sure there is not a vowel on the other side.
HW2 Problem #4 Card #3, E, is also important. E is a vowel. If the claim is true, this card must have an even number on the other side. If it has an odd number on the other side, then the claim is false. You must turn over #3 and make sure there is not an odd number on the other side.
HW2 Problem #5 Consider the following contingency table. I claim that I can predict which students will get an A in my course (Prediction = Yes = student will get an A) and which will not get an A (Prediction = No = student will not get an A).
HW2 Problem #5 So I got 37 out of 49 (37 + 12) of my “yes” predictions correct, for a rate of 75.5%. Additionally, I got 24 out of 76 (24 + 52) of my “no” predictions correct, for a rate of 31.6% Altogether, I got 61 out of 125 guesses correct, for a total of 48.8%.
HW2 Problem #5 Am I good predictor of which students will get an A or not? This is a hard question. Notice that I don’t do all that much better on guessing who gets an A than if I predicted that everyone would get an A. Then the chart would look like this:
HW2 Problem #5 I’ll accept any answer for this question, if you gave me some reasons for your answer, and those reasons aren’t crazy.
Bias Our expectations often influence how we evaluate claims and evidence. We easily accept as true those things that we expect to be true, but are much more skeptical about things that are unexpected.
Bias Bias can be a good thing. If someone tells you they saw a construction worker, it makes sense to believe them– construction workers are numerous, and we expect there to be numerous sightings of them. But if someone tells you they saw an extraterrestrial, things are different. You’ll be right to be skeptical: that is very unexpected.
Bias Bias can also be a bad thing. If you’re biased against black people (“blacks tend toward criminal behavior,” you think), then you might be more likely to accept a negative statement about someone who is black, and more skeptical of believing positive things about them– even if they’re totally innocent, wonderful human beings.
Loftus & Palmer 1974 How things are described to us can affect how we see them. In one study, subjects were shown pictures of a car accident involving multiple cars. They were asked: “About how fast were the cars going when they (hit/smashed/collided/bumped/contacted ) each other?”
Loftus & Palmer 1974 Additionally, the subjects were asked one week later whether they remembered seeing broken glass (from the cars) in the photographs. There was no glass, but subjects who had been asked “smash” or “collided” questions were more likely to remember some than subjects asked “contacted” or “hit” questions.
Context Affects Expectation This study shows that context (how a picture is described to us) can affect how we see a thing (the picture itself), and what we remember about it.
Studies have shown that people in many cultures have negative associations with the color black. They are biased against black-colored things.
Frank & Gilovich 1988 One study asked professional referees (for American football) to watch a video clip of a play and decide whether the players deserved a penalty. In one version of the clip, the players wore white; in another, their uniforms were changed to black.
Frank & Gilovich 1988 The referees were more likely to say that the players deserved a penalty if they were wearing black. Frank & Gilovich also found that teams with black uniforms actually did get penalized more often than teams with other colored uniforms!
Disconfirmation Bias Our biases can lead us to accept evidence that agrees with our views and reject evidence against our views, even when the “for” and “against” evidence is of the same quality.
Lord, Ross & Lepper 1979 One study looked at how people who were in favor of the death penalty evaluated arguments for and against it, and how people who were against the death penalty evaluated those same arguments. There were four types of arguments:
Lord, Ross & Lepper 1979 AGAINST-SAME. A study that showed that murder rates in a state increased after that state instituted the death penalty. AGAINST-DIFF. A study that showed that murder rates were higher in states that had the death penalty than in states that didn’t.
Lord, Ross & Lepper 1979 FOR-SAME. A study that showed that murder rates in a state decreased after that state instituted the death penalty. FOR-DIFF. A study that showed that murder rates were lower in states that had the death penalty than in states that didn’t.
Lord, Ross & Lepper 1979 All the subjects got one study AGAINST the death penalty and one study FOR it. If the study they got AGAINST it was the SAME condition, then they got FOR-DIFF; if the study they got AGAINST it was DIFF, then they got FOR-SAME.
Lord, Ross & Lepper 1979 People who liked the death penalty and received AGAINST-SAME and FOR-DIFF argued that SAME studies were bad, and DIFF ones were good. They liked the study that supported them. If they got AGAINST-DIFF and FOR-SAME, they argued the opposite: that DIFF studies were bad, and that SAME studies were good.
Lord, Ross & Lepper 1979 The same was true for people who opposed the death penalty: they liked SAME studies when they got AGAINST-SAME, but not when they got FOR-SAME; they liked DIFF studies when they got AGAINST-DIFF, but not when they got FOR-DIFF. Everyone liked the studies that agreed with them!
Lord, Ross & Lepper 1979 What’s interesting is that the arguments given by the subjects about why DIFF studies are bad (or why SAME studies are bad) were good arguments. No one was arguing in bad faith. But their biases made them see the flaws in studies that disagreed with them, and made them ignore the flaws in the studies that agreed with them.
Disconfirmation Bias This is sometimes called disconfirmation bias. It is the tendency to subject evidence against your views to a greater degree of scrutiny than evidence in favor of your views. It is a double-standard for evidence evaluation.