Download
1 / 40
400 likes | 562 Views
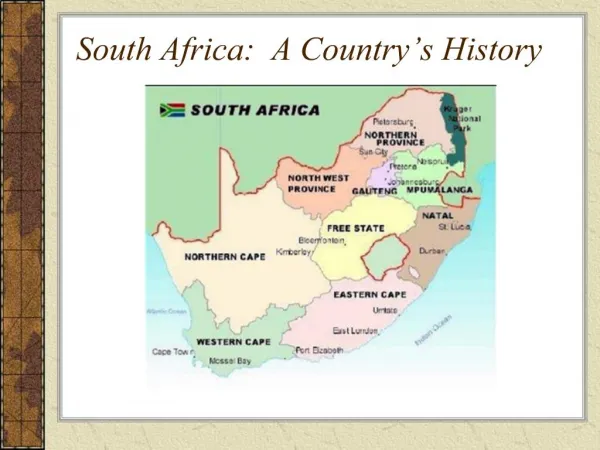
Country Risk and Capital Flows The case of South Africa by group no. 2. Background. South Africa has undergone a great deal of political change The implication were among a number of thinks a significant reduction in the country risk associated with investments in SA.

E N D
Country Risk and Capital Flows The case of South Africa by group no. 2
Background • South Africa has undergone a great deal of political change • The implication were among a number of thinks a significant reduction in the country risk associated with investments in SA. • Implementation in the GTAP model: • standard model and GE closure • no need for swaps
Implementation • Shock: • Estimate based on ‘real observations’ • Measure based on Deutchmark bond issues fell by 13.5 per cent • We shock the cgdslack by this amount (-13.5 per cent)
Model equations Expected rate of return rore(r) = rorg = cgdsslack Allocation of investments: rore(r) = rore(r) - RORFLEX*(ke(r)-kb(r))
Results - demand for intermediates and factors • Derived direct demand from cap. good sector • Techmnfc • Svces • Factor market effects • factor intensities in expanding sectors • factor prices (+) • Supply prices (zero profits) • Trade effects (effects on other regions)
Risk Premium decline: FTA among SA and Rest of Southern Africa • Pre-shock data FTA and Non-FTA • Post-shock data FTA and Non-FTA • Welfare effects on Rest of S. Africa
Post-shock: Increased Allocative Efficiency, Rest of Southern Africa Allocative effect 37 - mtax 47 Light manf Light manf ROW Tech manf 21 25 EU Tech manf Heavy manf Heavy manf Increased imports to RESTSAF from EU and ROW
Small Group II Extension: • Effects of Changing RORFLEX parameter
Introduction: The RORFLEX and The Rate of Return ApproachThe sensitivity of the RORFLEX Backward shock
Investment depends on ‘expected’ rate of return in next period This rate declines as capital stock rises.. The rate at witch this decline is expected is a function of the flexibility parameter RORFLEX(r ) > 0 So RORE( r )=RORC( r)[KE( r ) / KB( r )] -RORFLEX( r )
More about RORE( r)... ROR Flexibility(parameter) Expected rate of return End of period Capital stock RORE( r )=RORC( r)[KE( r ) / KB( r )] -RORFLEX( r ) Beginning capital stock Current period rate of return Thanks, to Soren and Rob
Modeling risk • The global bank equalizes risk-adjusted rates of return, so that risk-adjusted rates for all regions are egal to some global average; • with: • RORE( r)= non risk-adjusted expected rate of return • RISK( r)= ratio of equilibruim returns in region r to the global average rate of return
A risk premium We have RORE(r )/RISK( r)=RORG => RORE( r) = RISK( r) * RORG by total differentiation rore(r ) = rorg + risk( R) We have also rore(e)= rorg + cgdslack(s ) [equation 11’ , Hertel and Tsigas] so cgdslack(r )=risk(r ) ==> cgdslack is equivalent to the percentage change in the variable RISK We can refer to this, rather than risk
RORFLEX …and regional investment changes • A small RORFLEX needs large changes in end of capital stock, KE(r ), to induce small changes in RORE(r ) • THEN • Low values of RORFLEX(r ) lead to big changes in regional investment • High value lead to small changes:” In this case the supply of new capital goods is not very sensitive to changes in the expected return • We assume that investors behave that changes in regional rates of return are equalized across regions; • the global rate of return changes by the same percent :
THE SENSITIVITY OF THE RORFLEX RORE=f [RISK(r)] RORFLEX -13% Cgdslack(r ) 5% 10% 20% (Supply Capital) dK
Impacts of RORFLEX Impacts on net capital inflow and welfare effects. Simulations: change value of RORFLEX Shock is always the same (cgdslack = -13.5%) • RORFLEX = 10% (base run) • RORFLEX = 5% • RORFLEX = 20% RORFLEX is changed for all five regions.
5‘027 -414 +13.5% Backward shock Net Capital Inflow in SA 15’676 5’726 Time shock -13.5%
7’523 5’441 Why an Adjustment? Net Capital Inflow in SA 5’726 5‘027 -414 -1’797 Time
Possibilities of Adjustment Problem: Change of Investment is too big compared with the historical Values Possibilities: • Shock; Assumption is still the same (Shock cgdslack=+13.5%) • RORFLEX; Increase of RORFLEX reduces Investment
Calculated Value for RORFLEX 5’441 13.25
EXTENSIONAL SIMULATION GROUP 2 SINICHI YAMAGUCHI MANABU SHIMASAWA
How to shock ? • SHOCK BASE SHOCK capital inflow into South Africa: negative shock to “cgdslack” cgdslack("safrica") = -13.5 ADDITIONAL SHOCK technical progress at TECHMNFC & SVCES: positive shock to “ao” ao("TECHMNFC","SAFRICA") = 1.0 ao("SVCES","SAFRICA") = 1.0
Initial effects induced by Tech change Capital inflow = Direct Investment Capital Stock increase Management resource ( know-how , hi-tech etc)increase Technical Progress Price fall (equation (6’)) Output increase (equation(35)(36))
Welfare Decomposition (1) A : summarized welfare report
Welfare Decomposition (2) C1 : TECH decomp. Tech change C11 : AO cont. output augm. tech change
Market Price (pm) change % change
Volume change in Endowments BASE EXT
Export quantities change % change
SOME CONCLUSIONS Additional impacts on “ao( , )” cause : • SVCES sector growth • endowments concentration to SVCES • Other sectors scale decrease • Total export decrease (more capital inflow)
Y Y’Y’ Y” YY Y’ Y K K K’ K’ long run capital stock
Variable Original Endogenous Capital Stock Gross investment 36 US$ b 30 US$ b Depreciation 19 US$ b 22 US$ b Net Investment 17 US$ b 8 US$ b Capital Stock 0% 18% Rental price 7.6% -8.5% qgdp 0.6% 6.1%
Original Endogenous Capital Stock Bal. of Trade -10 US$ b -1 US$ b Welfare 3 US$ b 8 US$ b cnt_tot +1.9 US$ b -0.3 US$ b pexport (share) 99% 100% -------------------------------------------------------------------------------- Perc. changesExports Price Qty. Price Qty. Extraction 3.0 -13 -0.2 +0.7 Hvymnfc 6.3 -21 -1.6 +6.4 Svces 7.0 -18 -0.8 +2.2
Perc. changes Original Endogenous Capital Stock Price Qty. Price Qty. Capital 8 0 -9 18 Land -12 0 15 0 Nat. Res, -13 0 6 0 Unsklab 8 0 4 0 Sklab 10 0 4 0 -------------------------------------------------------------------------------- Agriculture 4.9 -3.9 -0.4 +3.3 Hvymnfc 6.3 -8.4 -1.6 +7.2 Svces 7.0 +2.7 -0.8 +6.0