Download
1 / 2
20 likes | 147 Views
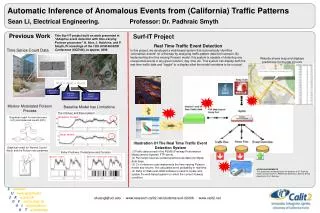
Baseline model. OBSERVED COUNT. NORMAL COUNT (UNOBSERVED). EVENT COUNT (UNOBSERVED). Ideal model. Previous Work. Surf-IT Project.

E N D
Baseline model OBSERVED COUNT NORMAL COUNT (UNOBSERVED) EVENT COUNT (UNOBSERVED) Ideal model Previous Work Surf-IT Project This Surf-IT project built on work presented in “Adaptive event detection with time-varying Poisson processes” A. Ihler, J. Hutchins, and P. Smyth, Proceedings of the 12th ACM SIGKDD Conference (KDD-06), to appear, 2006 Automatic Inference of Anomalous Events from (California) Traffic Patterns Real Time Traffic Event Detection In this project, we developed a web-based system that automatically identifies “anomalous events” on a freeway by analyzing traffic pattern data from sensors. By implementing the time varying Poisson model, this system is capable of detecting any unexpected events in any given location, day, time etc. This system can display both the real-time traffic data and "toggle" to a display what the model considers to be unusual. Time Series Count Data Website shows map and displays predictions for the last 2 hours 4 2 Markov Modulated Poisson Process Baseline Model has Limitations 1 The Chicken and Egg problem Sean Li, Electrical Engineering. Professor: Dr. Padhraic Smyth Graphical model for event process (z(t)) and observed counts (N(t)) Illustration Of The Real Time Traffic Event Detection System (1)Traffic data stored in the PEMS (Freeway Performance Measurement System) FTP server. (2) Perl script receives /extracts/parts/stores data into Mysql data base. (3) C++ inference code implements the time-varying Poisson model and returns the calculated event probability in real time. (4) Ruby on Rails and JAVA software is used to create and update the web-based system to reflect the current freeway condition. Graphical model for “Normal Counts” (No(t)) and the Poisson rate parameter False Positives, Persistence and Duration Baseline model Baseline model-lower threshold 3 ACKNOWLEDGEMENTS This project was conducted under the guidance of Dr. Padhraic Smyth and Jon Hutchins. PEMS Data collecting is done by EECS department at UC Berkeley. S ummer U ndergraduate 2R esearch 0F ellowship in 0I nformation6T echnology shuangl@uci.edu · www.research.calit2.net/students/surf-it2006 · www.calit2.net