Exploring Electronic Ferroelectricity in Organic Low-Dimensional Systems
This paper discusses the phenomenon of ferroelectricity, characterized by macroscopic electric polarization and its reversibility through external fields. In certain organic low-dimensional systems, electronic degrees of freedom lead to macroscopic electric polarization and ferroelectric transitions, a concept referred to as electronic ferroelectricity. The study delves into the mechanisms behind charge ordering and the phase diagrams of one-dimensional Hubbard models, along with experimental insights into the dielectric properties of various organic compounds, emphasizing their significant ferroelectric behaviors and applications.

Exploring Electronic Ferroelectricity in Organic Low-Dimensional Systems
E N D
Presentation Transcript
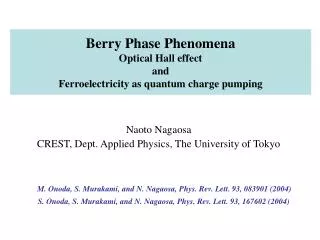
Ferroelectricity in organic low-dimensional systemsPierre Monceau*Institut Neel, CNRS and University Joseph Fourier, Grenoble, France* in collaboration with Felix Nad, Institut Kotel’nikov of Radioengineering and Electronics, RAS, Moscow, Russia
Ferroelectricityisdefined by the appearance of a macroscopicelectricpolarization and itsreversibility by applying an externalfield • For someferroelectricmaterials, electrondegrees of freedom and/or electronic interactions directlygiverise to a macroscopicelectricpolarization and a ferroelectric transition electronicferroelectricity
Electronic ferroelectricity for a review: S. Ishihara, J. Phys. Soc. Jpn 79, 011010, 2010
Ferroelectricity induced by charge ordering J.Van der Brick and D. I. Khomskii J. Phys.: Condens. Matter 20, 434217, 2008 S. Ishihara J. Phys. Soc. Jpn 79, 011010, 2010
1/4 filled band Shibata et al. Tsuchiizu et al. 2001 The mean field approximation of the 1D Hubbard model show that when V exceeds a critical value, Vc, , charge disproportionation occurs among sites with alternating « charge rich » and « charge poor » sites (Seo and Fukuyama 1997). With D ≠ 0 numerical calculations on the plane U and V for a fixed D where the metallic phase at D = 0 is replaced by the Mott insulating phase, and a phase with Wigner crystal-type CD is still present in the large U and V region S. Ejima et al. Europhys. Lett. 70, 051009, 2006 Ground state phase diagram of the 1D extended Hubbard model at 1/4 filling on the plane of U/t and V/t
Acknowledgements for samples J. M. Fabre Laboratoire de Chimie Organique, Montpellier, France MT. Nakamura and K. Furukawa Institute for Molecular Science, Okazaki, Japan H. Müeller ESRF , Grenoble, France H. M. Yamamoto Riken, Saitama, Japan K. Yamamoto Institute for Molecular Science, Okazaki, Japan
ECRYS 2008 Temperature dependence of the real part of the dielectric permittivity ' measured at 1MHz for (TMTTF)2Br and (TMTTF)2PF6 F. Nad, PM and J-M. Fabre J. Phys. IV 9, Pr10, 1999
Charge disproportionation C13 NMR spectra for (TMTTF)2AsF6 NMR measurements in an external field of 9T (fre 96.4 MHz) Below TCO, doubling of the spectral line due to two inequivalent molecules with unequal electron densities Charge disproportionation : 3:1 from T1-1 measurements Spectral splitting (~charge disproportionation order parameter)versus temperature D.S. Chow et al. Phys. Rev. Lett. 85 (2000) 1698 At high temperatures the unit cell consists of two equivalent TMTTF molecules related by inversion about the counterion. The breaking of the inversion symmetry within the unit cell below TCO, and the spontaneous dipole moment associated with the charge imbalance on the two molecules yield the ferroelectric behaviour.
AC conductivity of (TMTTF)2AsF6 100kHz T dependence of the conductance T dependence of the real part of the dielectric permittivity, ’ at 100 et 300kHz, 1,3 and 10MHz Nad et al.: J. Phys.:Cond. Matter, 12(2000)L435
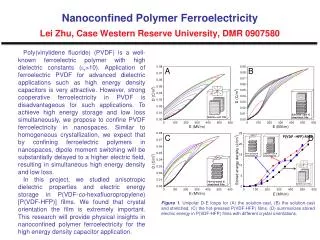
Real part of dielectric constant of (TMTTF)2X salts AsF6 ’ = ImG/ SbF6 ReO4 PF6 1- For all anions: at T≈ T, there is no anomaly 2- for CSA and ReO4 anions, ’diverges at TCO. Huge magnitudes of ’ : 2.106 for AsF6, 5.105 for ReO4
Anion ordering F. Nad and P.M. J.Phys. Soc. Jpn. 75, 051005, 2006
Imaginary part of the permittivity of(TMTTF)2AsF6 T > TCO = 101 K T <TCO
Motion of domain walls Frequency of the maximum in ’’ the same at T=97 K and T=105 K (TCO = 101K) The slow relaxation processes involved in the shoulder of ’’ may correspond to the motion of the domain wall structure developped in the ferroelectric state Freezing of the ferroelectric domain structure below 90K = TCO - 10K
Ferroelectric character The ferroelectric state is triggered by the uniform shift of anions yielding a macroscopic ferroelectric polarization which is gigantically amplified by the charge disproportionation on the molecular stacks ( S. Brazovski and T. Nattermann, Adv. In Phys. 53, 177, 2004) CSA and ReO4 salts show at TCO a second order phase transition described by the Curie law A ’ = ---------- T- TCO 1/ ’ (T) is close to be linear Ratio AL / AH (AL at TTCO AH at T>TCO) in CSA: AL / AH ≈ 2 in ReO4 AL / AH ≈ 1.5 PF6 SbF6 AsF6 ReO4 Phys. Rev. Lett. 86 (2001) 4081
(ET)2X compounds Mott insulator in the case of half-filled band, due to strong interactions between electrons with strong U between neighoring sites If U is large, it is more favourable to localize the particules on the lattice sites to minimize the repulsion and the system is an insulator • In presence of strong dimerization • as in -(ET)2X compounds, a single • electron occupy the bonding state • of each dimer half-filled band • and to the insulating state due to • the effect of U • [ called a dimer-Mott state - • Hotta et al.: Chem. Rev. 114 (2004)]
Structures of and - (BEDT-TTF)2RbZn(SCN)4 and -(BEDT-TTF)2I3 Y. Tanaka and K. Yonemitsu J. Phys. Soc. Jpn 79, 024712, 2010
Stripe phases Different spatial patterns of stripe phases are stabilizeddepending on the anisotropy of the transfer integrals tc and tp and of the values of intersite Coulomb energies along the stacking direction Vc and along the bonds in the transverse direction Vp Seo: J. Phys. Soc. Japan 69 (2000) 805
Metal-insulating phase transition in -(BEDT-TTF)2I3 Abrupt phase transition at T=135.1K of first order Transition slightly hysteretic in specific heat with latent heat[Fortune et al. Solid St. Comm 77 (1991) 265] Change of intensity of Bragg peak (for reflections only with an odd index with the a-component) (Nogami et al. Synth. Metals 16 (1986) 367 And T. Kakiuchi et al. J. Phys. Soc. Jpn. 76, 113702, 2007) Dimerization of stacks I along the a axis of Peierls type Relative change of the sample length along a, b and c* Measured by capacitive dilatometry et x-ray diffraction from Heidmann etal.: Solid St. Comm. 84 (1992) 711
Charge ordering from NMR in -(BEDT-TTF)2I3 13C-NMR spectra at different temperatures below the M-I transition, the spectra consist of two Pake doublets. The positions of the two doublets have differentT dependences. That indicates two differently charged BEDT-TTF molecules below the transition: Also from Raman spectroscopy Wojciechowski etal. Phys. Rev. B67 (2003) 224105 from Takano et al. J. Phys. Chem. Solids 62 (2001) 393
Charge disproportionation Horizontal stripe structure CD already above CO transition From infrared spectroscopy, NMR, and x-ray At room temperature: A=A’= 0.60 B=0.68 C=0.44 In the CO state: A=0.81 A’= 0.26 B=0.74 C=0. 23 T. Kakiuchi et al. J. Phys. Soc. Jpn 76, 113702, 2997
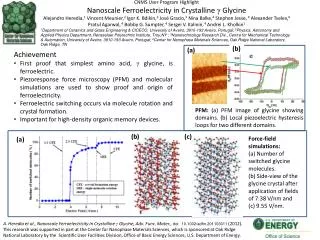
ac conductivity in -(BEDT-TTF)2I3 Dielectric constant at 2MHz (sample 1) Conductivity Drop of ’ below TMI Structural transition (dimerization) Dielectric constant (sample 2)
3 orders of magnitude jump of conductivity at TMI with hysteresis Tcooling=199K, Theating=204.5K • -charge gap below TMI = 1900K much larger than in (TMTTF)2AsF6 with =350K • -’(T) shows a smooth monotonic increase from room temperature, more sharp, • closed to divergence near TMI • ’(T) jumps down to a small magnitude sharply below TMI • -the same jump up of ’ in heating First order transition • The ’ growth above TMI may indicate the polarizability of the charge disproportionation seen in • NMR. The jump below TMI is associated with the 2c superstructure and the large charge gap • • Role essential of the structural transition in the metal-insulating transition (posssibly alter the • symmetry and the magnitude of the transfer integrals relative to V)
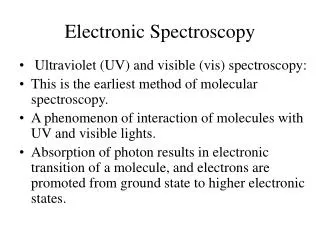
Low temperature dielectric response in -(BEDT-TTF)2I3 Frequency dependence of the real (ε') and imaginary (ε'') part of the dielectric function in α-(BEDT-TTF)2I3 for E // [1¯10]. Below 75 K, two dielectric relaxation modes are observed T. Ivek et al. Phys. Rev. B83, 165128, 2011
Optical second harmonic generation Activation of the even-order nonlinear optical phenomenom signifies the lack of inversion symmetry K. Yamamoto et al. J. Phys. Soc. Jpn, 77, 074709, 2008
Observation of ferroelectric domains by SHG interferometry a)Transmission image SH images at 140K (b) and 50K (c). d) SH image after annealing above Tco and slow cooling at T=50K e) SH intensity versus T K. Yamamoto et al. Appl. Phys. Lett. 96, 122901, 2010
Photoexcitation in -(BEDT-TTF)2I3 For ordinary feroelectrics, polarization is induced by lattice modulation. In -(BEDT-TTF)2I3, the crystal shows a monotonic lattice shrinkage without substantial displacement of molecules (structural modulation makes a minor contribution to the polarization) The polarization is mainly due to the modulation of the electron distribution caused by CO. The large value of SHGsignal indicates the growth of large polar domains. Then, if polarization originates from electron phenomena, fast response to external perturbations is expected. Pump-probe measurement of the SHG : stimulation of the CO by strong pumping pulse and recorded the induced variation of the SHG with a weaker probing pulse Melting of the CO See also the suppression of the SHG femtosecond signal in TTF-CA
Femtosecond photoresponse The time required for CO melting and generation of the metallic state is 15fs. at 20K. The early stage photo-induced dynamics is driven by the electron response. Additional slower (300fs) growth indicates interplay between electron oscillations and vibrations K. Yamamoto et al. J. Phys. Soc. Jpn, 77, 074709, 2008 See also:Y. Kawakami et al. Phys. Rev. Lett. 105, 246402, 2010 Y. Tanaka and K. Yonemitsu, J. Pjys. Soc. Jpn. 79, 024712, 2010 H. Nakaya et al. Phys. Rev. B81, 155111, 2010 Photoinduced variation of reflectivity and second harmonic generation (SHG) as the function of the delay time between pump and probe pulses. T=100K.
Charge ordering from NMR in - (ET)2RbZn(SCN)4 13C-NMR with H=8T normal to the conducting layers With T decrease, the spectra become broadened indicating a continuous molecule to molecule distribution of Knight shift. Below 195K, the spectrum consits of a broad line (A) (with a much larger relaxation rate)and a paket doublet (line B). Separation of the BEDT-TTF into two inequivalent molecules Also from vibrational spectroscopy K. Yamamoto et al. Phys. Rev. B65 (2002) 085110 from Miyagawa et al. Phys. Rev. B62 (2000) R7679
3 orders of magnitude jump of conductivity at TMI • with hysteresis Tcooling=199K, Theating=204.5K • -charge gap below TMI = 1900K much larger than • in (TMTTF)2AsF6 with =350K • -’(T) shows a smooth monotonic increase from • room temperature, more sharp, closed to divergence • near TMI • ’(T) jumps down to a small magnitude sharply below TMI • -the same jump up of ’ in heating • The ’ growth above TMI may indicate the polarizability of the charge disproportionation seen in NMR • The jump below TMI is associated with the 2c superstructure and the large charge gap • • Role essential of the structural transition in the metal-insulating transition (posssibly alter the symmetry • and the magnitude of the transfer integrals relative to V)
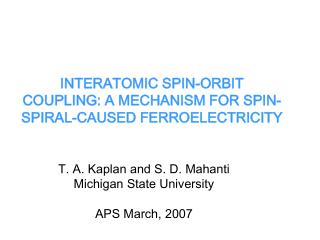
Effect of cooling rate on the CO in - (ET)2RbZn(SCN)4 1) conductivity F. Nad, PM and H.M. Yamamoto Phys. Rev. B76, 205101, 2007
Effect of cooling rate on the CO in - (ET)2RbZn(SCN)4 2) Dielectric permittivity F. Nad, PM and H.M. Yamamoto Phys. Rev. B76, 205101, 2007
Glass-like state in - (BEDT-TTF)2CsZn(SCN)4 F. Nad, PM and H.M. Yamamoto J. Phys.: Conden. Matter 20, 485211, 2008
Neutral-ionic transition • The neutral-ionic transition is caused by the energy gain of the long range Coulomb interaction • overcoming the effective ionization energy of DA pairs. • There is a finite transfer energy between the D and A molecules in the mixe-stack CT compounds, • the degree of CT () between D and A is not equal to 0 and 1. • is 0.3 and 0.7 between the N and I phases , respectively. • In the I phase, each molecule has spin S=1/2, constituting 1D spin chains, • which are dimerized due to the spin-Peierls mechanism. Neutral chains Ionic chains
Dielectric response TTF-p-cloranil (TTF-CA) H. Okamoto et al. Phys. Rev. B43, 8224, 1991
Ferroelectric domains Electroreflectance microscopy The domain wall (DW) is located between the rightward polarized domain (IA) and the leftward one (IB) The direction of spontaneous polarizations, Ps, in IA and IB are opposite while the electric-field-induced polarizations, P, in IA and IB are parallel These changes in polarization are accounted for the change in the charge transfer, H. Kishida et al. Phys. Rev. B80, 205201, 2009
SHG in TTF-CA Generation dynamics of metastable N phase fraction converted from the stable ferroelectric I phase at 77K. The second harmonic generation (SHG) disappears within 100ps. The amount of converted N phase starts to increase around 100ps after the excitation light pulse - flash illumination 1230fs - (60% at around 500ps delay time) Luty et al. Europhys. Lett. 59, 619, 2002
TTF-p-bromanil TTF-BA TTF and BA molecules are almost ionic. The D+A- stacks can be regarded as a 1D Heisenberg chain with spin 1/2. F. Kagawa et al. Nature Phys. 6, 169, 2010
Magnetoelectric coupling in TTF-BA F. Kagawa et al. Nature Phys. 6, 169, 2010