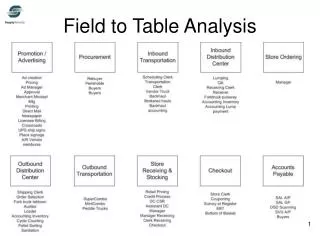
Optimizing SKU Management and Checkout Efficiency: Cost-Saving Opportunities Explored
Over the last three years, SKU proliferation grew by 33%, yet sales and profit remain stagnant. Our analysis examines the efficiency of SKU management, highlighting key insights from checkout productivity to inbound transportation. With an average checkout speed of 7.13 seconds per item, even a 1-second improvement could save $9.4 million in labor costs annually. Recommendations include refining inbound transportation processes and adjusting minimum case order quantities to boost productivity and reduce costs.

Optimizing SKU Management and Checkout Efficiency: Cost-Saving Opportunities Explored
E N D
Presentation Transcript
SKU Proliferation Over the last 3 years SKUs grew by 33%, but sales/profit had not
SKU’s below $25 sales in current month Didn’t include zero sales items, too hard to acquire data for this analysis
Store Checkout Safety - ergonomics Customer service / speed Labor productivity
Checkout Data • 7.13 seconds per item • Based on 22 separate time studies • Equivalent to $0.44 per case (labor cost) • Total checkout labor cost $67.2 million • Reduce 1 second per item-transaction equal to: • $9.4 million labor savings
Observations • Safety implications in scanning • One checkout - 15 min for 96 items • UPC on shrink-wrap veggies not scan-able • Competitors – multiple UPC on package • Competitors – aggressive beam technology • Coupons take extra time • EBT transactions take extra time • Customer survey at register takes extra time
Inbound Transportation Vendor Product shipped to Distribution Center
Data & Observation • Our process does not promote reducing inbound transportation costs • Vendor transported vs. In-House Broker or Backhaul • Currently company handles only 18% of all inbound loads • Industry standard: 36% • Each 1% increase equals net $471,500 annually • Reaching 36% equals net $8.5 million annually
Recommendations • Process flow mapping project • Backhaul, brokering & vendor truck • Procurement, distribution & accounting • Identify decision gaps & non-value added steps • Design new process incorporating best-cost options • Deeper understanding of the implications of changes to our current process/method • Change the process of how we handle inbound transportation
Data & Observations Data collected from Winchester DC March 12th, 2009
Data & Observations 1.9 sec drop
Case Productivity Data • Company previously had a 3 case minimum for many items, but it was changed • If we had a 3 case minimum for the DCs • Need 10 fewer Order Selectors ($360,000) • If we had a 3 case minimum for Stores • Stocking times are about 3x of a DC order selection • Need 30 fewer Stockers ($540,000) • Reality is that this improves scheduling at the store and will impact labor productivity