Download
1 / 16
160 likes | 163 Views
Health Insurance Coverage Eight Years After the ACA: Fewer Uninsured Americans and Shorter Coverage Gaps, But More Underinsured. Findings from the Commonwealth Fund Biennial Health Insurance Survey, 2018. Sara R. Collins, Ph.D. Vice President, Health Care Coverage and Access

E N D
Health Insurance Coverage Eight Years After the ACA:Fewer Uninsured Americans and Shorter Coverage Gaps, But More Underinsured Findings from the Commonwealth Fund BiennialHealth Insurance Survey, 2018 Sara R. Collins, Ph.D. Vice President, Health Care Coverage and Access The Commonwealth Fund Media Teleconference February 6, 2019
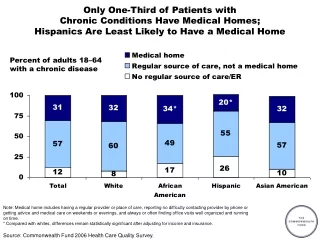
FINDINGS FROM THE COMMONWEALTH FUND BIENNIAL HEALTH INSURANCE SURVEY, 2018 What is Inadequate Insurance Coverage? Working age adults fall into four mutually exclusive categories of insurance, based on their survey responses: • 1 • Uninsured at the time of the survey; INADEQUATELYCOVERED 2 Insured at the time of the survey, but report a coverage gap in the past 12 months; 3 Continuously insured over the past 12 months, but is underinsured; 4 Continuously insured over the past 12 months, and not underinsured.
FINDINGS FROM THE COMMONWEALTH FUND BIENNIAL HEALTH INSURANCE SURVEY, 2018 Who is Underinsured? The underinsured measure is based on a continuously insured adult’s reported out-of-pocket costs over the course of a year and the health plan deductible. The measure does not include premiums. Someone is considered underinsured if: • Out-of-pocket costs over the prior 12 months are 10 percent or more of household income; or • Out-of-pocket costs are 5 percent or more of household income if income is under 200 percent of poverty ($24,120 for an individual and $49,200 for a family of four); or • Deductible is 5 percent or more of household income.
FINDINGS FROM THE COMMONWEALTH FUND BIENNIAL HEALTH INSURANCE SURVEY, 2018 Summary of Major Findings • Today, 45 percent of U.S. adults ages 19 to 64 are inadequately insured • This is nearly the same as in 2010 — but important shifts have taken place. • Compared to 2010, many fewer adults are uninsured, and the duration of coverage gaps people experience has shortened significantly. • More people who have coverage are underinsured now than in 2010, with the greatest increase among those in employer plans. • Despite actions by the Trump administration and Congress to weaken the ACA, the adult uninsured rate was 12.4 percent in 2018 in this survey, statistically unchanged from 2016. • People who are underinsured or spend any time uninsured report cost-related problems getting care and difficulty paying medical bills at higher rates than those with continuous, adequate coverage.
FINDINGS FROM THE COMMONWEALTH FUND BIENNIAL HEALTH INSURANCE SURVEY, 2018 Since the ACA, Fewer Adults Are Uninsured, but More Are Underinsured Insured all year, not underinsured Insured now, had a coverage gap Insured all year, underinsured Uninsured now Percent of adults ages 19–64 Notes: “Underinsured” refers to adults who were insured all year but experienced one of the following: out-of-pocket costs, excluding premiums, equaled 10% or more of income; out-of-pocket costs, excluding premiums, equaled 5% or more of income if low-income (<200% of poverty); or deductibles equaled 5% or more of income. “Insured now, had a coverage gap” refers to adults who were insured at the time of the survey but were uninsured at any point in the 12 months prior to the survey field date. “Uninsured now” refers to adults who reported being uninsured at the time of the survey. Data: Commonwealth Fund Biennial Health Insurance Surveys (2003, 2005, 2010, 2012, 2014, 2016, 2018).
FINDINGS FROM THE COMMONWEALTH FUND BIENNIAL HEALTH INSURANCE SURVEY, 2018 Since the ACA, Gaps in People’s Coverage Have Been Shorter Percent of adults ages 19–64 insured now but had a coverage gap in past year Data: Commonwealth Fund Biennial Health Insurance Surveys (2001, 2010, 2012, 2014, 2016, 2018).
FINDINGS FROM THE COMMONWEALTH FUND BIENNIAL HEALTH INSURANCE SURVEY, 2018 More Adults Are Underinsured, with the Greatest Growth Occurring Among Those with Employer Coverage Percent of adults ages 19–64 insured all year who were underinsured Notes: “Underinsured” refers to adults who were insured all year but experienced one of the following: out-of-pocket costs, excluding premiums, equaled 10% or more of income; out-of-pocket costs, excluding premiums, equaled 5% or more of income if low-income (<200% of poverty); or deductibles equaled 5% or more of income. Total includes adults with coverage through Medicaid and Medicare. Respondents may have had another type of coverage at some point during the year, but had coverage for the entire previous 12 months. ^ For 2014 and 2016, includes those who get their individual coverage through the marketplace and outside of the marketplace. Data: Commonwealth Fund Biennial Health Insurance Surveys (2003, 2005, 2010, 2012, 2014, 2016, 2018).
FINDINGS FROM THE COMMONWEALTH FUND BIENNIAL HEALTH INSURANCE SURVEY, 2018 Fewer Adults Report Not Getting Needed Care Because of Costs, but Gains Have Stalled in Recent Years • Percent of adults ages 19–64 who reported any of the following cost-related access problems in the past year: • Had a medical problem but did not visit doctor or clinic • Did not fill a prescription • Skipped recommended test, treatment, or follow-up • Did not get needed specialist care Data: Commonwealth Fund Biennial Health Insurance Surveys (2003, 2005, 2010, 2012, 2014, 2016, 2018).
FINDINGS FROM THE COMMONWEALTH FUND BIENNIAL HEALTH INSURANCE SURVEY, 2018 Inadequate Coverage Is Associated with More Cost-Related Problems Getting Needed Care Insured all year, not underinsured Insured now, had a coverage gap Insured all year, underinsured Uninsured now Percent of adults ages 19–64 who had any of four access problems in past year because of cost* Notes: * Includes any of the following because of cost: did not fill a prescription; skipped recommended medical test, treatment, or follow-up; had a medical problem but did not visit doctor or clinic; did not see a specialist when needed. “Underinsured” refers to adults who were insured all year but experienced one of the following: out-of-pocket costs, excluding premiums, equaled 10% or more of income; out-of-pocket costs, excluding premiums, equaled 5% or more of income if low-income (<200% of poverty); or deductibles equaled 5% or more of income. “Insured now, had a coverage gap” refers to adults who were insured at the time of the survey but were uninsured at any point in the 12 months prior to the survey field date. “Uninsured now” refers to adults who reported being uninsured at the time of the survey. Data: Commonwealth Fund Biennial Health Insurance Survey (2018).
FINDINGS FROM THE COMMONWEALTH FUND BIENNIAL HEALTH INSURANCE SURVEY, 2018 Fewer Adults Have Difficulty Paying Their Medical Bills, but the Improvement Has Stalled • Percent of adults ages 19–64 who reported any of the following medical bill or debt problems in the past year: • Had problems paying or unable to pay medical bills • Contacted by a collection agency for unpaid medical bills • Had to change way of life to pay bills • Medical bills/debt being paid off over time Data: Commonwealth Fund Biennial Health Insurance Surveys (2005, 2010, 2012, 2014, 2016, 2018).
FINDINGS FROM THE COMMONWEALTH FUND BIENNIAL HEALTH INSURANCE SURVEY, 2018 Inadequate Coverage Is Associated with More Problems Paying Medical Bills Insured all year, not underinsured Insured now, had a coverage gap Insured all year, underinsured Uninsured now Percent of adults ages 19–64 who had medical bill or debt problems in past year* Notes: * Includes any of the following: had problems paying or unable to pay medical bills; contacted by collection agency for unpaid medical bills; had to change way of life to pay bills; medical bills/debt being paid over time. “Underinsured” refers to adults who were insured all year but experienced one of the following: out-of-pocket costs, excluding premiums, equaled 10% or more of income; out-of-pocket costs, excluding premiums, equaled 5% or more of income if low-income (<200% of poverty); or deductibles equaled 5% or more of income. “Insured now, had a coverage gap” refers to adults who were insured at the time of the survey but were uninsured at any point in the 12 months prior to the survey field date. “Uninsured now” refers to adults who reported being uninsured at the time of the survey. Data: Commonwealth Fund Biennial Health Insurance Survey (2018).
FINDINGS FROM THE COMMONWEALTH FUND BIENNIAL HEALTH INSURANCE SURVEY, 2018 Continuously Insured Adults, Including Those Underinsured, Are More Likely to Get Preventive Care Insured all year, not underinsured Insured now, had a coverage gap Insured all year, underinsured Uninsured now Percent of adults ages 19–64 Notes: “Continuously insured” refers to adults who were insured for the full year up to and on the survey field date. “Underinsured” refers to adults who were insured all year but experienced one of the following: out-of-pocket costs, excluding premiums, equaled 10% or more of income; out-of-pocket costs, excluding premiums, equaled 5% or more of income if low-income (<200% of poverty); or deductibles equaled 5% or more of income. “Insured now, had a coverage gap” refers to adults who were insured at the time of the survey but were uninsured at any point in the 12 months prior to the survey field date. “Uninsured now” refers to adults who reported being uninsured at the time of the survey. Respondents were asked if they: had their blood pressure checked within the past two years (in past year if has hypertension or high blood pressure); had their cholesterol checked in past five years (in past year if has hypertension, heart disease, or high cholesterol); and had their seasonal flu shot within the past 12 months. Data: Commonwealth Fund Biennial Health Insurance Survey (2018).
FINDINGS FROM THE COMMONWEALTH FUND BIENNIAL HEALTH INSURANCE SURVEY, 2018 Continuously Insured Adults, Including Those Underinsured, Are More Likely to Get Cancer Screenings Insured all year, not underinsured Insured now, had a coverage gap Insured all year, underinsured Uninsured now Percent of adults ages 19–64 Notes: “Continuously insured” refers to adults who were insured for the full year up to and on the survey field date. “Underinsured” refers to adults who were insured all year but experienced one of the following: out-of-pocket costs, excluding premiums, equaled 10% or more of income; out-of-pocket costs, excluding premiums, equaled 5% or more of income if low-income (<200% of poverty); or deductibles equaled 5% or more of income. “Insured now, had a coverage gap” refers to adults who were insured at the time of the survey but were uninsured at any point in the 12 months prior to the survey field date. “Uninsured now” refers to adults who reported being uninsured at the time of the survey. Respondents were asked if they: received a Pap test within the past three years for females ages 21–64, received a mammogram within the past two years for females ages 40–64, and received a colon cancer screening within the past five years for adults ages 50–64. Data: Commonwealth Fund Biennial Health Insurance Survey (2018).
FINDINGS FROM THE COMMONWEALTH FUND BIENNIAL HEALTH INSURANCE SURVEY, 2018 Policy Options to Increase Coverage and Lower Costs • Increase Coverage: • Expand Medicaid without restrictions. • Ban or place limits on short-term health plans and non-ACA compliant plans. • Reinsurance, either state or federal. • Reinstate outreach and navigator funding. • Lift the 400-percent-of-poverty cap on eligibility for marketplace tax credits • Reduce Coverage Gaps: • Inform the public about special enrollment periods. • Make it easy to enroll in and keep Medicaid. • Extend the open enrollment period. • Lower Out-of-Pocket Costs: • Fund and extend the cost-sharing reduction subsidies. • Increase required deductible exclusions. • Refundable tax credits for high out-of-pocket costs. • Protect consumers from surprise medical bills. • Slow Overall Rate of Growth in U.S. Health Care Costs • Address impact of consolidation and lack of competition in health care. • Apply clinical value assessments in prescription drug purchasing. • Expand use of primary care to patients with complex care needs.
FINDINGS FROM THE COMMONWEALTH FUND BIENNIAL HEALTH INSURANCE SURVEY, 2018 Conclusion and Policy Implications • U.S. working-age adults are significantly more likely to have health insurance since the ACA became law in 2010. • But the improvement in uninsured rates has stalled. • In addition, more people are underinsured, with the greatest growth occurring in employer plans. • The ACA made only minor changes to employer insurance, and the erosion in cost protection has taken a bite out of the progress made in Americans’ health coverage since the law’s enactment. • Federal and state policy makers have a number of options to expand and improve coverage. • Ongoing efforts to slow overall health care cost growth are also needed.
FINDINGS FROM THE COMMONWEALTH FUND BIENNIAL HEALTH INSURANCE SURVEY, 2018 How This Study Was Conducted • Respondents completed telephone interviews in English or Spanish conducted by SSRS from June 27 to November 11, 2018. • Study includes a nationally representative sample of 4,225 adults ages 19-64 living in the continental United States. • A combination of landline and cell phone random-digit dial (RDD) samples was used to reach respondents. • Statistical results are weighted to correct for the stratified sample design, the overlapping land-line and cellular phone sample frames, and disproportionate nonresponse that might bias results. The data are weighted to the U.S. adult population by age, sex, race/ethnicity, education, house-hold size, geographic region, population density, and household telephone use, using the U.S. Census Bureau’s 2017 Annual Social and Economic Supplement. • The survey has an overall margin of sampling error of +/– 1.9 percentage points at the 95 percent confidence level. • Study also reports estimates from 2001, 2003, 2005, 2010, 2012, 2014, and 2016 Commonwealth Fund Biennial Health Insurance Surveys conducted by Princeton Survey Research Associates International (PSRAI).