Download
1 / 18
190 likes | 443 Views
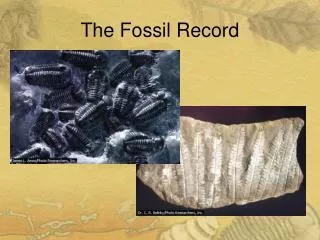
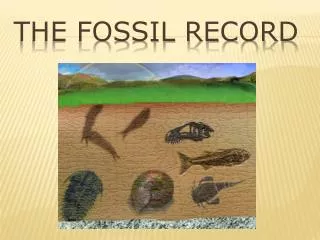
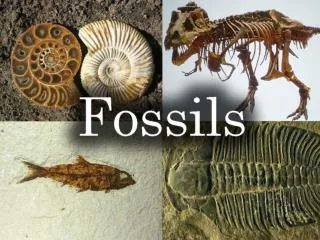
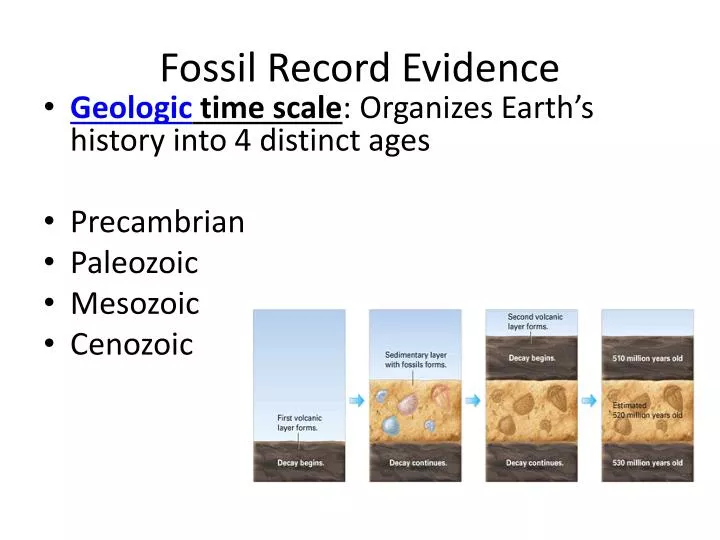
Fossil Record Evidence. Geologic time scale : Organizes Earth’s history into 4 distinct ages Precambrian Paleozoic Mesozoic Cenozoic. Fossil Record Evidence. Younger fossils are layered over older ones Radiometric Dating determines absolute age

E N D
Fossil Record Evidence • Geologic time scale: Organizes Earth’s history into 4 distinct ages • Precambrian • Paleozoic • Mesozoic • Cenozoic
Fossil Record Evidence Younger fossils are layered over older ones Radiometric Dating determines absolute age Half life is the # of years it takes for 50% of the sample to decay Different elements have different half lives Carbon-12 and Carbon-14 are used to determine the age of fossils Why do we use carbon????
Continental Drift • Pangaea: Supercontinent of all land masses during the Paleozoic Era (250 million years ago) • Explains matching fossils found in different continents • Pangaea broke up 180 million years ago separating the continents and creating different evolutionary patterns for species that had common ancestors
Mass Extinction • Brief periods of mass species loss-There have been five or six distinct periods of mass extinction over the last 600 million years. • Most recent- Cretaceous period 65 million years ago • Dinosaurs had lived for 150 million years • What happened? Climate cooling, sea reduction, meteor near Yucatan Peninsula (polluted the sky and reduced sunlight which lead to reduced food production by photosynthesis)
Mass Extinction • The Permian period, when extinction claimed over 90% of the species of marine animals and 70% of terrestrial animals.
What is Taxonomy? The identification, naming, and classification of species Many common names can be too confusing and make it difficult to organize into something that makes sense: Catfish, silverfish, jellyfish, and crayfish Each name is similar but each are very different organisms Biologistsmust be able to communicate with one another about the species they study, no matter what language they speak. Goal: of taxonomy is to assign a universal scientific name to each known species
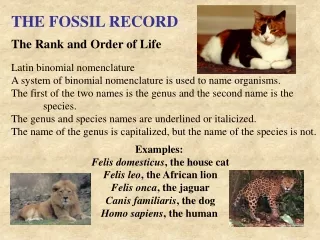
The Linnaean System of Classification -Created by Carolus Linnaeus (1707-1778) -Two main characteristics of this system oTwopart Latin name for each species oAnordering of species into broader and broader groups. Naming system - Binomial system (two parts) 1.genusto which the species belongs 2.second part refers to one species within the genus Examples: Pantherapardus = Leopard Pantheraleo = Lion
Humans would be classified as the following: Kingdom: Animalia Phylum: Chordata Class: Mammalia Order: Primates Family: Hominidae Genus: Homo Species: sapiens Humans = Homo sapiens
Classification and Evolution • Darwinused this system to help explain the context of evolution. • Species are classified into groups within groups. • -Creation of the phylogenetic tree (means evolutionary history) • A diagram that reflects such hypotheses of evolutionary relationshipsand has a branching pattern • A good visual to help relate different species • Often created by comparing homologous structures
While creating these phylogenic trees, scientists have to be aware of convergent evolution - process in which unrelated species from similar environments have adaptations that seem very similar - analogous structures: similarities among unrelated species that result from convergent evolution Examples: Bats and insects both fly but their structures are very different Whale flippers and bat wings adaptations have changed the look of the structures but the bones are very similar(why?)
Molecular Data as a Taxonomic Tool modern techniques include comparing DNA of each species’ genomes fossil and DNA data have indicated that whales are closely related to the group of mammals that includes: hippos, cows, deer, and pigs. Molecular data has backed up this hypothesis. Able to revise phylogenic trees
Comparisons of cladograms: Clade: The evolutionary branch in a phylogenic tree. A phylogenetic diagram that specifies the derived characters of clades is called a cladogram - features that unite the organisms as a clade are called derived characters. Example:Each shaded area in the phylogenetic tree highlights one clade (branch), such as the right hand area including species B through H.
Each Cladogram can compare particular traits between close species to show close evolutionary relationships:
The Development of Classifications • Two Kingdom Schemes • Linaeusdivided life into “Plants” and “Animals” • Used for over 200 years • Lots of organisms who didn’t fit the model • Current Model: Six Kingdom Classification