Download
1 / 31
310 likes | 467 Views
Search for protective Epstein Barr virus (EBV) epitopes in the rabbit model. *Rajčáni, J, *Szenthe, K, **Ďurmanová, V, ***Ásványi, B, *Sollner, J, *Lantis, Zs, Stipkovits, L, ****Szathmary, S *RT-Europe, Virology laboratory, Mosonmagyaróvár, Hungary,

E N D
Search for protective Epstein Barr virus (EBV) epitopes in the rabbit model. *Rajčáni, J, *Szenthe, K, **Ďurmanová, V, ***Ásványi, B, *Sollner, J, *Lantis, Zs, Stipkovits, L, ****Szathmary, S *RT-Europe, Virology laboratory, Mosonmagyaróvár, Hungary, **Department of Immunology, Medical Faculty, Com. Univ., Bratislava, Slovakia ***Food Microbiology, University of Western Hungary and ****Galenbio, Mosonmagyaróvár, Hungary
Contents • Introducing the rabbit model of Epstein-Barr virus (EBV) infection (Rajčáni et al., Intervirology 57, 5, 239-310, 2014). • Recapitulation of the principles for selection of protective EBV proteins (glycoproteins) and of their immunogenic epitopes (Rajčáni et al., in Recent patents on Anti-infective Drug Discovery 9, 1, 1-15, 2014; Söllner J. et al.: Immunome Res. 4, Jan 7; p.1. 2008). • A rationally designed epitope vaccine (Szathmary S. et al., Galenbio, CA). • Presenting an attempt for in vivo efficacy of EBV vaccines: statistical analysis of infection markers instead of the traditional lethality or morbidity based protection tests.
The rabbit model of EBV infection: pitfalls and solutions • The need of a high infectious dose (108-109 DNA copy per animal) for eliciting symptoms and/or signs of infection (no practical infectious dose titration available). • Long term observation periods are needed until post-infection signs occur. • Controversy concerning to the hematologic changes seen in rabbits: do they resembleto infectious mononucleosis (IM) in man? • Determinationof methods for reliable assessment of EBV replication in rabbit tissues: a possible way for grading preventionfollowing immunization. • Establishment of latency in EBV infected rabbits.
The ELISA test in EBV infected rabbits • For each plate, one column (8 wells) was used for the control reagents provided by manufacturer (anti-human IgG kit). • Instead of single serum dilution testing (as recommended), we determined the final dilution, at which the ISR value (immune status ratio) became negative (lower than 1.1) . • The interpretation of the ELISA resultsusing thecapsid antigen (p23/p18) was confusing, whenpre-infection sera (interval 0) showed falsepositive binding at basic dilution (1:20, occasionally even at 1:40). • In contrast, the EA-D/p54 ELISA test showed more precise results, which correlated with the virus dose administered (more frequent and higher ISR values following the higher virus dose). • We came to conclusion that EA-D antibodies might reflect the replication of inoculated virus (later confirmed by immunoblot). • In contrast, VCA ELISA was considered reflecting the antibody response to the EBV antigens administered.
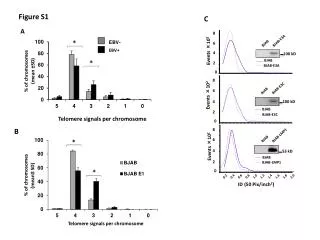
Antibodies to the capsid antigen in EBV infected rabbits *interval 0 = the serum was obtained 7 days before virus inculation VCA (recombinant p23/p18) coated immunoplates (provided by Trinity Biotech kit). The serum samples were testedat days 8, 28 and 98 p.i. Above: in 10 rabbits(inoculated with 3-4x10⁸ EBV DNA) there was no false positive binding of pre-infection sera to immunoplates. Below: in 10 rabbits (infected 1x10⁹ EBV DNA copies) the pre-infection sera showedfalse positive binding to VCA-coated immunoplates. In 4 of them the anti-VCA response could not be interpreted. Conclusion: The capsid antibody response seemed delayedeven after the higher virus dose; thus,these results seem confusing.
The early antibody response in EBV infected rabbits A *interval 0 : 7 days before virus infection Antibodies against EA-D (Trinity Biotech kit): the immunoplates were coated with the recombinant p54, a cofactor of DNA synthesis; the antibodies were determined at days 8, 28, and 98 p.i. False positive binding was not found: neither in group A (at above, with exception of a single serum, no. K4) nor in group B (below). The EA-D antibody response was less prominent in group A (above), being more intensive and frequent in group B (below). The slightly higher inoculation dose (1x10⁹ DNA copies) elicited a more extensive antibody response (as compared to inoculation of 3-4x10⁸ EBV DNA copies) B Conclusion at single glance: the EA-D antibody response better corresponded to the given EBV dose.
The IgG response* as detected by immunoblot (antibodies to structural and non-structural proteins including Zta/BZLF1) capsid BZLF1 Day 98 (autopsy) Day 28 More antibodies of higher avidity were seen on day 98 p.i. (exception K1/2). No anti-EBNA1 was found. p54 (BMRF1, DNA polymerase associated), p138 (BALF2, ssDNA binding protein). Early proteins * In group A rabbits infected with the lower virus dose capsidearly
Positive rates of IgG antibodiesagainst five EBV proteins as seenin immunoblot strips Above the time dependent response:At least 65 % of EBV infected rabbits revealed antibodies to the BZLF1/Zta transactivation polypeptide at day 98, whileon day 28 this response was less frequent by nearly 20%. Below the dose dependent response: the frequency of antibodies to each protein was higher following the larger inoculation dose (black columns are the rabbits of group B). Conclusion: The positive rates of IgG antibodies detected by IB increased by time as well as following the virus dose.
Comparison of the IgG response in EBV infected rabbits (as detected by immunoblot and ELISA)* *by over 3 months, i.e. on day 98 p.i., only 17 out of 20 infected animals were still available) The IB bands and ELISA results correlated in 15 out 17 animals (poor correlation was seen in sera nos. N3/3 and N5/3). A faint reaction to transactivation protein BZLF1/Zta wasdetectedin 2 samples with negative EA-D ELISA (in the absence of p54 band the VCA/p23 antibodies were present). EBNA1 ANTIBODIES WERE MISSING.
Conclusions from serological examinations • At 3 months p.i., the correlation between IB bands and ELISA results was excellent in 13 out of 17 animals and satisfactory in 2 additional rabbits. • When comparing the p54 bands with the EA-D ELISA reults, the positive rate of the latter was slightly lower than that of the former. • At later post-infection interval, the IB reactive antibodies occurred at higher frequency and showed more intensive bands. • The presence of antibodies to Zta/BZLF1 (transactivator protein) correlating with the p54 antigen band (DNA polymerase cofactor) might indicate the replication of EBV in permissive rabbit tissues. • No EBNA1 antibody was found by IB. This suggests that latency I (as found in man) has not developed, at least not during the 98 day observation period. • We conclude that the EBV DNA might have been eliminated (cleared) from white blood cells in the majority of EA-D and IB/p54 positive rabbits (shown up later).
The rare detection of EBV DNA in peripheral white blood cells (WBC)* Repeated run with several controls Posit contr 1 2 3 4 5 6 7 8 9 10 11 12 13 14 15 16 17 18 19 20 21 22 M 1 = K10/2; 2 = K121/2; 3 = K14/2; 4 = N3/2; 5 = N5/2; 6 = K10/2;7 = K12/2;8 = K14/2; 9 = N3/2; 10 = N5/2; 11 = F2/K1E; 12 = F2/K2/E; 13 = F2/K1M (pozitive); 14 = F2/K2M; 15 = F2/K1E; 16 = F2/K2/E; 17 = F2/K1M (pozitive); 18 = F2/K2M; 19 = B95-8 DNA extract1:100; 20 = B95-8 DNA extract 1:1000; 21 = LCL721 DNA extract 1:100. 22 – watercontrol and marker ladder (100 bp to 1200 bp). LMP1 primers: LMP1forward (169 724-169 741)* sequence 5´-GGG CAA GCT GTG GGA ATG-3´ (18bp) LMP1reversed (169 911-169 892)* sequence 5´-CTC ACC TGA ACC CCC CTA -3´ (18bp) *As described for the B95-8 derived DNA sequence (Baer et al., 1984)
Survey of LMP1 antigen (by IF) and DNA detection (by classical PCR)in WBC The EBV DNA presence and LMP1 antigen in WBC agreed at day 8 (once K13), at day 28 twice (K3, K21) and 3 times at day 98 (K12, N5 and K2). The DNA in WBC and spleen correlated at day 98 (K10); WBC and spleen DNA as well as the LMP1 antigen in WBC agreed once at day 98 in K2. In one case (K18) the DNA was found only; in two cases (K1, K14) single LMP1 positivity was seen which might be regarded non-specific (PCR was negative).
Lower frequency of DNA presence in comparison to serology in EBV infected rabbits The positive rate of EA-D antibodies as detected by ELISA compared to that found by IBwas lower on day 98; on day 28 both methods showed equal frequency (about 70%). The EBV DNA as detected by PCR in WBCs was considerably less frequent (it correlated well with the frequency of LMP1 antigen expressed in WBCs). We conclude that individual tests for assessing EBV infection in rabbits are the following: IB >EA-D ELISA > EBV DNA (PCR) > LMP1 (IF). The above shown 4 tests were considered reliable for the efficacy of selected EBV peptides.
Atypical monocytes and high lymphocyte levels in blood smears of EBV infected rabbits WBC = white blood cells The WBCs separated by Ficoll gradient show lymphocytosis The proportion of infected rabbits (per cent calculated from 20 animals), which developed highpercentage of lymphocytes (>60%) and/or that of atypical mononuclear cells (>10%)is shown at individual post-infection intervals. Atdays8 and 28 a considerable proportion of animals (close to 30%) revealed the presence of atypical cells. The frequency of animals developing lymphocytosis correlated with the EA-D antibody rate especially on day 28. These findings were not regarded to represent the IM-like syndrome.
EBV immunogenic proteins and their epitopes* *as reviewed by Rajčáni et al., in Recent patents on Anti-infective Drug Discovery (2014)
The EBV epitopes selected for this study • The selection of EBV antigens suitable for formulation of protective vaccine was based on: • a rational strategy combining literature data andapplication of biological principles • considering the EBV receptors and pathogenicity mechanisms, • computer based reverse vaccinology and systemic biology (by Söllner J. et al.: Analysis and prediction of protective continuous B-cell epitopes on pathogen proteins. Immunome Res. 2008 • Jan 7;4, p.1. *number of epitopes coming from each of 12 proteins (the aa. positions epitope can not be shown, sorry)
Manufacturing of the microbead formulations (at GalenBio, California*) Proprietary coupling chemistries to attach precise amounts of a carefully selected combination of epitopes and PRR (pathogen recognition receptor) agonists to the microparticles. The coupled ligands are stable for years at room temperature. Thoroughly characterized, totally controlled manufacturing system – scalable virtually to any volume. Over 20 year experience in manufacturing microparticles(particles larger than 100 µm) at commercial scale (1000+ L lots) under ISO/cGMP-compliant conditions for chromatographic separations of FDA/EMEA licensed biologics. *patented by Szathmary S., et al.
The rationally designed epitope vaccine components PRR = pathogen recognition receptor (non-specific) Antigen Peptide epitopes* PRR agonists & immune modulators Adjuvant Vaccine Carrier Microparticles *Always 3 out of 16 selected epitopes (from 12 EBV proteins) were coupled to the carrier in 19x3 (57) combinations. Typically, one B-cell and two T-cell stimulating epitopes (for one helper and one cytotoxic lymphocyte) were mixed. At least one peptide derived from non-structural protein was present.
The synthetic multivalent peptide vaccine Pathogen-mimicking (Stealth)MicroparticlesTM- PMM produced by Galenbio PRR = pathogen recognition receptor (non-specific) PRR agonist (LPS) T-helper cell epitope 2 Cytotoxic T-cell epitope (1) Cytotoxic T-cell epitope (1) B-cellepitope (3) PRR agonist(R848) T-helper cell epitope (2) B-cell epitope (3) PRR agonist(IC) The PMM have been designed to interact with various receptors (Toll-like, B and T cells). LPS =lipopolysaccharide; R848 = resimiquod; IC = poly I/poly C
Testing thePMM* formulations in vitro Directing PMM to target cells – APCs (dendritic cells and macrophages) and theafter monitoringtheir movements. Beads coated with PRR agonists (i.e. PMM) and selected epitopes were applied together, since even short peptides can interfere with some immune stimulation pathways. Efficacy of the carrier microbeads (PMM) in vitro was made by following its uptake into CD80/86 cells and consequently measuring interleukin induction in DCs. * Pathogen mimicking microparticles
Targetting of PMMinto DCs and macrophages(APCs detected according to the CD80/86 marker) CD80-/CD86- The particulate beads were coated with the PRR agonists as well as with the selected epitopes to apply both components together. The PMM uptake into cells expressing the CD80/86 marker was demonstrated by cell sorter. CD80+/CD86- CD80+/CD86+ CD80-/CD86+ CD86 CD80 Example of FACS analysis of PMM uptake by dendritic cells (DCs) and macrophages.
Cytokines inducedin vitroby the 19 different PMM formulations coated with the EBV epitopes Five epitope mixes exerted the most intensive effectin mature DCs.
Well protected immunized rabbits after their challenge developed minimal antibody response (category I) Category I consistedeither ofthe immunization groups showing a minimal EA-D antibody response (on day 8 post infection only, groups 1 and 16) or of groups revealing no EA-D response at all (number 6, 12, 13, 15, 17 and 18 not shown). One out of 3 rabbits,immunization group14 (depicted in the left), revealed a potent EA-D response by day 108 post-challenge (therefore, this immunization group was shifted to category II). Conclusion: out of 19 immunization groups, 7 ones (1, 6, 12, 13, 15, 16, 17 and 18) showed a minimal or no serological response when examined by EA-D ELISA.
The EA-D response in slightly protected groups (category II) was following challenge signifantly more frequent The immunized and challenged animals of category II (groups number 3, 4, 5, 7, 8, 9, 10 and 19) encompassed rabbits, which revealed a moderate EA-D response (2 or 3 serum samples positive). Group 14 from the previous slide was included into this category. Conclusion: category II consisted of 10 immunization groups (3, 4, 5, 7, 8, 9, 10, 14 and 19) showing a minimal protection only.
Not protected immunized rabbits (category III) behaved after challenge as infected controls Immunized and challenged animals (in groups 2 and 11)showed an EA-D response similar to mock-immunized controls. The EA-D response in the controls was the highest by day 108. In contrast, in immunization group 2 the stronger response occurredon day 28. Nevertheless, both immunization groups showed positive results that did not differ from the control group. Conclusion: 2 immunization groups (2 and 11) showed an antibody response similar to controls.
Positive rates at antibody testing by immunoblot As detected by IB, the category I immunization groups showed a minimal or negative antibody response, which differed from that seen in rabbits of categories II and III (as well as from non-immunized controls).
Summary of serological methods (EA-D ELISA and IB positive rates)
Survey of serological results in immunized and challenged rabbits The immunized rabbits ofcategory I (which have been considered for protected against EBV challenge) finally encopassed 5 immunization proups, since 3 groups (number 13, 16 and 17) were shifted into category II due to relatively frequent IB results. The category II of immunized rabbits fell into 2 subcategories: 2A. Slightly protected rabbits (7 groups: 9, 10, 13, 14,16, 17 and 19). 2B. Not protected rabbits (5 groups: 3, 4, 5, 7 and 8) shifted to category III 4. Category III: originally consisted of 2 groups (clearly unprotected rabbits not differing from the infected non-immunized controls)but later on 5 groups (mentioned under paragraph 2B) were transferred here, so thattogether 7 immunization groups could not be considered as protected.
EBV DNA and LMP1 antigen detections in rabbits of categories II and III Conclusion: no EBV DNA was found in category I (protected) rabbits
Summary of positive rates after including all 4 examination techniques (statistical calculations)
Summary The novel EBV peptide vaccine presented here is a mix of microparticles, to which the immunostimulation molecules have been bound along with the selected EBV peptides. The 19 combinations of selected 16 epitopes were tested in vitro as well in vivo (using the rabbit model elaborated in our laboratory). When the peptide vaccine was tested in dendritic cells, 5 of selected epitope combinations induced the most prominent cytokine formation. In vivo, the protective effect at least 5 mixes (containing 7 selected epitopes out of 16) exerted a significant protective effect. In addition, a very moderate (or slight effect) was noticed after immunization with 7 mixes, while no effect was found after immunization with the rest of 7 mixes. We conclude that the rabbit model might be used for EBV vaccine efficacy in vivo provided that the frequency of reliable signs of EBV challenge are compared by statistical methods.