Download
1 / 23
230 likes | 339 Views
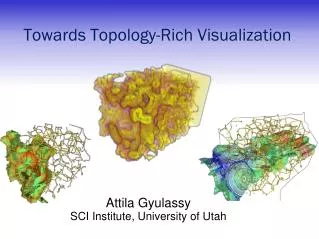
Uncertainty in Analysis and Visualization Topology and Statistics. V. Pascucci Scientific Computing and Imaging Institute, University of Utah in collaboration with D. C. Thompson, J. A. Levine, J. C. Bennett, P.-T. Bremer, A. Gyulassy , P. E. Pébay.

E N D
Uncertainty in Analysis and VisualizationTopology and Statistics V. Pascucci Scientific Computing and Imaging Institute, University of Utah in collaboration with D. C. Thompson, J. A. Levine, J. C. Bennett, P.-T. Bremer, A. Gyulassy, P. E. Pébay
Massive Simulation and Sensing Devices Generate Great Challenges and Opportunities Satellite BlueGene/L Earth Images EM Retinal Connectome Jaguar Cameras Carbon Seq. (Subsurface) Hydrodynamic Inst. Molecular Dynamics Climate Turbulent Combustion Photography Porous Materials
Data from Many Sources • Where is data “uncertain” coming from? • High Spatial Resolution (Massive grids) • Varying parameters, Time (Ensembles) • Many fields (pressure, temperature, ….) • Stochastic Simulations (Distributions/point)
Many Techniques Apply • Honest assessment of data driven information Analysis Parameter Space Streamline A Streamline B Unstable Manifolds Simulation Parameter Space
Hixels:A Possible Unified Representation • Hixels: • A pixel/voxel that stores a histogram of values • Can be used to: • Compress blocks of large data • Encode the ensembles of runs per location • Discretize the distribution • Trade data size/complexity for uncertainty
Hixels: 2d Example(Ensemble) Normal x9600 Poisson x3200 Mean Hixels (Histogram drawn vertically)
Some Basic Manipulations of the HixelsRepresentation • Re-Sampling • Bucketing Hixels • Analyzing Statistical Dependence of Hixels • Fuzzy Isosurfacing • …… suggestions for more?
Re-Sampling from Hixels • One way to represent a scalar field is by sampling the hixels per location. • Generate (many) instances Vi of downsampled data by selected a value for each hixel at random using the distribution. • Treat this as a scalar field, apply various techniques to analyze. • Initial basic assumption (probably not true): hixel data is independent.
Convergence of Sampled Topology 8x8 Hixels Persistence Distribution of Topological Boundaries Over Many Realizations
Convergence of Sampled Topology Persistence Distribution of Converged Topological Boundaries Over Data Simplification
Statistically Associated Sheets • Not all values in hixels are independent • Consider data as an ensemble • Each “sample” is per run, not per location • There may be certain (statistical) associations between neighboring values • Use contingency tables to represent which values in adjacent hixels are related
Topological Bucketing of Hixels Ordering pairs of critical points by the area between them (hypervolume persistence ). Eliminates peaks by the probability associated with them.
Bucketing Hixels • Hixels of size 16x16x16 • 256 bins/histogram • Hypervolume Persistence varied from 16 to 512 by powers of 2 hp=16 hp=32 hp=64 hp=128 hp=256 hp=512
Contingency Tables:PointwiseMutual Information pmi(x,y)=0 => x independent y
Sheets Basins of Maxima Basins of Minima
More Sheets 163 Hixels 323 Hixels 643 Hixels Red = 27 buckets/hixelsBlue = 1/bucket/hixel
Fuzzy Isosurfaces • Slicing histograms:
Comparison • Stag Beetle with 163hixels • Vs. mean & lower-left isosurfaces • Isovalue 580 • Original size 832x832x494
Questions? • Jet with 23, 83, and 323hixels • Isovalue 0.506 • Original size: 768x896x512