Download
1 / 17
170 likes | 303 Views
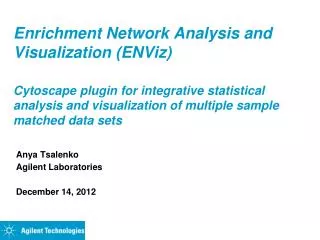
Network Analysis For Coalescing Binary (or any analysis with Matched Filtering). Benoit MOURS, Caltech & LAPP-Annecy March 2001, LSC Meeting Baton Rouge, Louisiana LSC Session: ASIS. The basic issue. What is the best way to analyze data from 2 or more detectors?

E N D
Network Analysis For Coalescing Binary(or any analysis with Matched Filtering) Benoit MOURS, Caltech & LAPP-Annecy March 2001, LSC Meeting Baton Rouge, Louisiana LSC Session: ASIS
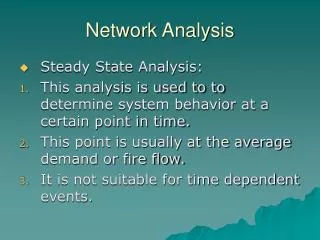
The basic issue • What is the best way to analyze data from 2 or more detectors? Combine the data streams and analyze it or Analyze each stream and combine the results? • How this could be applied/tested on a single detector
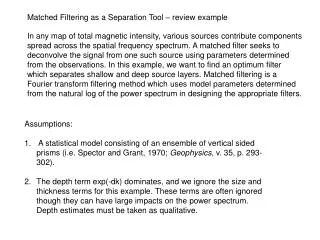
For one detector one has to compute: a = detector/source location h = data t = template c = noise The orientation part could be taken out of the integral: For more than one detector Method 1: build a new h’(t) which is a linear combination of each h(t). Method 2: a,h,t,c become matrices. The principles
Build a new ‘pseudo detector’: a linear combination of the detector outputs. Need proper whitening/weighting to not bias the data. Need new templates: linear combination of the single templates Problem: If the detector are at different locations, the location dependant part of the template could not be factorized. For LLH-LLO orientation is about the same, need to include the time delay: data flow increased by one or two orders of magnitude. For LIGO-GEO/VIRGO/TAMA the orientation is not the same. Many more orders of magnitude Multi detector: Linear Combination
Replace scalars by vectors (dimension: number of detectors). Problem: If C is not diagonal (correlated noise between detectors), A and C do not commute and the integral could not be simplified Solution 0. Just compute the Ndet2 integrals Solution 1. Build a pseudo detector by mixing h(t)’s Then mix the templates still Ndet2 integrals to compute More complex templates, detectors problems mixed Solution 2. Correlation should be negligible (if not, the data contain a strong technical noise). Ndet integrals to compute. The result is the sum of the individual analysis. LLR = A1LLR1+A2LLR2+… Question: Could we easily sum single analysis?? Multi detector: Matrices
The needed computing resources for binary search are large, especially : for low mass if we start at low frequency The chirp spend most of its time at low frequency. Waist of computing resources? Case of one single Detector Frequency time
Principle: Transform a single detector to a multiple one Split the analysis in a few frequency bands: Analyze independently each band Combine coherently the analysis result like for a network of detectors Remarks: The SNR should be unchanged. Single detector ?
h(t) h(t) 4kHz h(t) 256Hz Sum Template +FFT-1 FFT h(t) 64Hz M M time time The Multi Band Analysis Method frequency time time Max. search time Events Parameters • Remarks: • All sub analysis cover the same parameter space BUT may have different grids. • Need interpolation to combine the results and search for the maximum. • All FFT are small FFT. Templates for the high frequency low frequency
CPU = K fmin-8/3 fs log2(fmin fmax ) (simplify model: Ntemplate.FFT cost) T = Template length (seconds). = T0fmin-8/3 Ntemplate= T/template spacing Nsample= 2T fmax CPU = Ntemplate 6Nsamplelog2(Nsample)/T = K fmin-8/3 fmax log2(fmin fmax ) Estimation of CPU resources CPU For two bands Frequency Hz
Storage = K fmin-16/3 fs log2(fmin fmax ) (simplify model: Ntemplate.tempSize) T = Template length (seconds). = T0fmin-8/3 Ntemplate= T/template spacing Nsample= 2T fmax Storage = 2 NtemplateNsample = K fmin-16/3 fmax log2(fmin fmax ) Estimation Template Storage Storage For Two Bands Frequency Hz
If fmin = 40 Hz, fmax = 2kHz, Mmin = 0.5M 1 Band 2 Bands 3 Bands CPU(Gflops) 30 1.3 0.6 Storage (Gbytes) 300 5 2.4 T. size (Mbytes) 2 0.13 0.04 If fmin = 20 Hz, fmax = 2kHz, Mmin = 0.5M 1 Band 2 Bands 3 Bands CPU(Gflops) 200 4.3 1.3 Storage (Gbytes) 10000 100 43 T. size (Mbytes) 11 0.6 0.2 Estimation of computing resources
Does it works? Test with 2 bands Low freq. band (50-82Hz) sampling: 400Hz High freq. band (>82 Hz) sampling: 2kHz Single band (> 50 Hz) sampling: 2kHz Templates used White noise + 3 solar mass (2PN) signal
Comparison of the noises The combined bands reproduce well the single band analysis (noise and signal)
Losses 2.7% Losses 23% (losses ratio: 8) If signal and template are mismatched Signal:M=2.99 The parameter space is 8 time larger, The templates are 5 times smaller reduction of ~10 for CPU, 40 for template storage
Network: It is more efficient to do separate analysis and combine results It is possible to combine coherently the analysis results. The Multi Band Analysis has many advantages No SNR change Reduce the computing requirements Work on small FFT (fit in the CPU cache, use single precision) Build-in hierarchical approach without compromise on SNR Build-in consistency tests More study in progress Implementation problems? Is the gain as good as expected? Building a prototype code Summary