Download
1 / 28
280 likes | 416 Views
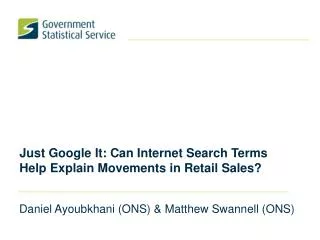
Just Google It: Can Internet Search Terms Help Explain Movements in Retail Sales?. Daniel Ayoubkhani (ONS) & Matthew Swannell (ONS). Contents. Introduction to Google Trends Existing Literature Aims of Current ONS Research Data Methods Results Conclusions Considerations.

E N D
Just Google It: Can Internet Search Terms Help Explain Movements in Retail Sales? Daniel Ayoubkhani (ONS) & Matthew Swannell (ONS)
Contents • Introduction to Google Trends • Existing Literature • Aims of Current ONS Research • Data • Methods • Results • Conclusions • Considerations
1. Introduction to Google Trends • Google provide information on search query share for a given week • Data are available in 25 top level categories and hundreds of lower level categories • Reported as how share of search queries has grown since 1st week of January 2004
1. Introduction to Google Trends Search Query: Football Transfers Source: Google Insights for Search
1. Introduction to Google Trends Search Query: Football Transfers Summer Transfer Deadline Reached January Transfer Deadline Reached Summer Transfer Window January Transfer Window
2. Existing Literature Choi, H and Varian, H (2009) Predicting the Present with Google Trends: • Paper pioneered use of Google Trends (GT) data as a nowcasting tool • Applied log–linear “nowcast” to US retail sales • Performance of models increased when Google Trends data were included
2. Existing Literature Chamberlin, G (2010) Googling the Present, Economic and Labour Market Review (Dec 2010): • Modelled 11 UK Retail Sales Index (RSI) time series • Relatively simple benchmark models • Alternative models included GT category data as predictors • GT terms significant in eight models
3. Aims of Current ONS Research Focus of this investigation: quality assurance of the UK RSI • Fit benchmark models that are representative of current ONS practice • Fit alternative models that include appropriate GT terms as predictors • Compare models using empirical measures • Draw conclusions to inform ONS strategy
4. Data – Retail Sales Index • All Retail Sales • Non-Specialised Food Stores • Non-Specialised Non-Food Stores • Textiles, Clothing and Footwear • Furniture and Lighting • Home Appliances • Hardware, Paints and Glass • Audio and Video Equipment and Recordings • Books, Newspapers and Stationary • Computers and Telecommunications • Non-Store Retailing
4. Data – Retail Sales Index All extracted RSI time series: • represent monthly GB retail sales • start in January 1988 • end in June 2011 • are not seasonally adjusted • are chained volume indices
4. Data – Retail Sales Index Source: ONS
4. Data – Google Trends • All extracted GT time series: • represent weekly UK search activity • start in January 2004 • end in July 2011 • Each RSI series matched with: • at least one GT search category • top five search queries with each category
4. Data – Google Trends • Raw data are weekly growth rates in query shares • Indices constructed by setting first full week in January 2004 to 100 and applying growth rates • Monthly data formed by taking weighted averages of weekly data
5. Methods – Benchmark Models • Each RSI “month” is 4- or 5-week long period (SRP) • Disparity between survey and Gregorian months evolves by one or two days each year (“phase shift”) • One-week long survey break every five or six years • Example – September SRP:
5. Methods – Benchmark Models Therefore SRPs not comparable with each other due to: • their compositions • moving holidays
5. Methods – Benchmark Models • Regression models used to estimate phase shift effects • Example – Spring bank holiday variable:
5. Methods – Benchmark Models Differenced (regular and seasonal) Log transformed Follows an ARMA process
5. Methods – Alternative Models Benchmark models extended with (log transformed, differenced) GT variables • Static relationships estimated for all series • Lagged relationships modelled where identified • Relationships identified at more than one lag modelled both individually and together • Multiple regression models estimated for RSI series matched with more than one GT search category
5. Methods – Alternative Models Lagged relationships identified from cross-correlation plots of pre-whitened series • ARIMA models fit to all RSI and GT series • used the (0,1,1)(0,1,1) model for all series • Each RSI residual series correlated with each of its corresponding GT residual series • series exhibit common trends and seasonality, so correlate the shocks
5. Methods – Alternative Models • Example – Furniture and Lighting vs “garden”
5. Methods – Alternative Models • Example – Furniture and Lighting vs “garden” No significant phase shift effects so models are:
6. Results – Furniture and Lighting Top three alternative models in terms of AICC
6. Results – Furniture and Lighting Top three alternative models in terms of MAPE • Out-of-sample, one-step-ahead predictions • 12 periods: July 2010 – June 2011
7. Conclusions • Promising results for some RSI components... • Furniture and Lighting • Hardware, Paints and Glass • Audio Equipment and Recordings • ...but less so for others • All Retail Sales • Non-Specialised Food Stores • Non-Specialised Non-Food Stores Additional information is only useful when the RSI series is not dominated by trend and seasonality
8. Considerations • GT variable selection • Transitory nature of search queries • Changes to GT category taxonomy • Future cost and accessibility of GT data? • Wider applicability to ONS outputs?