Data Logging
Data Logging. Mehnaaz Asad IB2-3. What is data logging?.

Data Logging
E N D
Presentation Transcript
Data Logging Mehnaaz Asad IB2-3
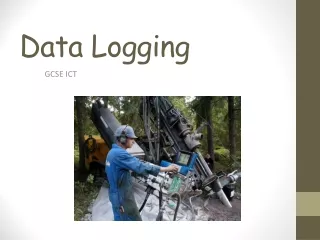
What is data logging? Data logging is the collection of data over a period of time, and is something often used in scientific experiments. Data logging systems typically monitor a process using sensors linked to a computer. Most data logging can be done automatically under computer control.
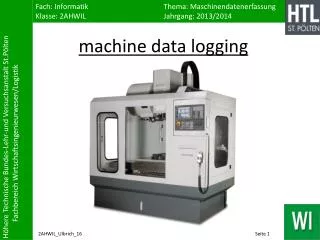
IT System: Hardware Sensors Data-logger is a basic box capable of picking up and storing signals from sensors. Computer Normally, the sensors are plugged into the data-logger circuit box which in turn is connected to the computer. Optionally, a printer is also useful for printing out graphs on paper.
IT System: Software The common functions of a data-logging program are as follows: • Take readings from the sensors at regular intervals. It is possible to take many readings at time intervals ranging from a few microseconds to hours or even days. • Present the data in a suitable form of display on the screen.The graph plotting facility is particularly useful since the computer can generate them very quickly allowing the software to compare several sets of results.Also, the program provides aids for accurately analysing the results and performing calculations on the data. • Print the data table or graph on paper using a printer connected to the computer. • Store the data on a computer disc for future use.
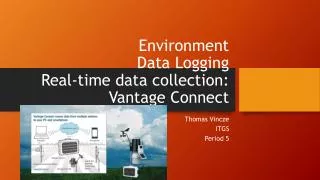
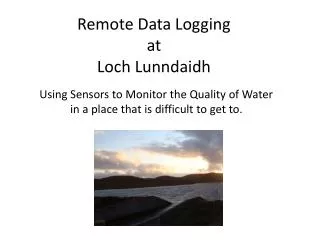
Different types of data logging Continuous recording The rapid repetition of measurements (hundreds of values per second) Simultaneous recording Measurements from several sensors may be collected simultaneously. Period logging Data may be collected over a period of hours or days. Remote Logging Data may be collected independently from the computer using a data- logger. Data logger may be sited in locations which are not convenient for computers.This is well-suited to longer term experiments. Delay A data logger may be set up so that it waits for a specified time before beginning to log data.
Process • The sensors send signals to an interface box, which is linked to a computer. The interface box converts analogue signals to digital signals that the computer can understand. • The computer controlling the process will take readings at regular intervals. The time interval for data logging is the time between readings. The logging period is the total length of time over which readings are taken. • The readings are stored in tables and can be displayed in graphs or passed to an application, such as a spreadsheet, for later analysis.
Example 1 The following describes an experiment to determine the rate at which water cools down from boiling point: Atemperature sensor is placed in the liquid. The sensor is connected to an interface box linked to the computer. The data loggingsoftware is set to take readings every 30 seconds (time interval) for 25 minutes (logging period).
Interpretation The data logging software will typically store the readings in a table. The data can later be analysed using graph tools. A graph which could be used in this experiment is a cooling curve graph.
Other examples How much light would a leaf get? (light sensors) Best thermal insulators? (temperature sensors) What material is most sound proof? (sound sensors) What are the best atmospheric conditions for a greenhouse? (combination of sensors)
PROS • Improves the accuracy • Collects information from scientific experiments and monitoring systems faster than humans • Displays the results in a graphical form • Prints out and analyses the results • Ease of use / display on a screen / drafts and analysis of the results. • Remote logging enables to calculate the experiments from remote locations that are inaccessible by humans and many computers.
CONS • Storing data logging systems in the databases is very complex and hard to manage • It is hard to implement the data logging system. • Software has to be designed properly, in order to work with the hardware. • High performance computers are needed in order to analysethe data.
Social and Ethical Issues People and Machines: We are becoming too dependent on the technology and, if necessary, might not be able to perform the actual experiment that confidently. Equality of Access: Those who don’t have access to this technology lose out and have to record data manually. Integrity: The data entered has to be correct and accurate, or else it raises the issue of reliability as well. Health: You don’t have to come in direct contact with any harmful chemicals while recording the data.You can monitor from a safe distance.
SOURCES http://www.ruthtrumpold.id.au/itgswiki/pmwiki.php?n=DataLogging.DataLogging http://www.ncte.ie/documents/advicesheets/32DataloggingNov08.pdf http://www.bbc.co.uk/schools/gcsebitesize/ict/measurecontrol/3dataloggingrev1.shtml http://www.hitchams.suffolk.sch.uk/datalogging/examples.htm