Download
1 / 1
10 likes | 163 Views
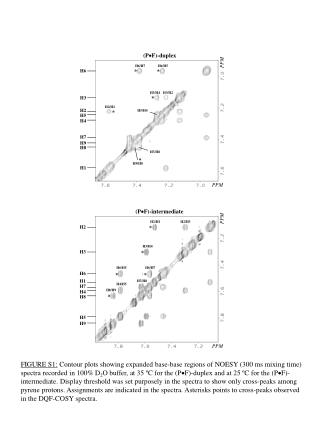
This study presents contour plots illustrating the expanded base-base regions of NOESY spectra recorded in 100% D2O buffer at two different temperatures: 35°C for the (PF)-duplex and 25°C for the (PF)-intermediate. The display threshold was strategically set to highlight only the cross-peaks among pyrene protons, facilitating the identification of key assignments within the spectra. Asterisks indicate cross-peaks observed in the DQF-COSY spectra, providing further insights into molecular interactions.

E N D
(PF)-duplex PPM H6/H7 H6/H5 * * H6 H3/H4 H3/H2 * H3 H2/H1 H2 H5/H4 * H5 H4 H7 H9 H8 H7/H8 * H9/H8 H1 PPM (PF)-intermediate PPM H2/H1 H2/H3 H2 * H3/H4 H3 * H6/H5 H6/H7 H6 * * H1 H7/H8 H4/H5 H7 H8/H9 H4 * H8 H5 H9 PPM FIGURE S1: Contour plots showing expanded base-base regions of NOESY (300 ms mixing time) spectra recorded in 100% D2O buffer, at 35 ºC for the (PF)-duplex and at 25 ºC for the (PF)-intermediate. Display threshold was set purposely in the spectrato show only cross-peaks among pyrene protons. Assignments are indicated in the spectra. Asterisks points to cross-peaks observed in the DQF-COSY spectra.