Download

1 / 9
310 likes | 1.32k Views
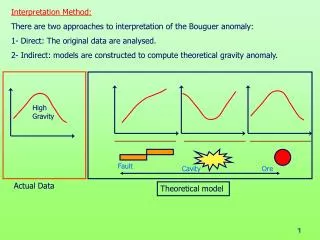
Interpretation Method: There are two approaches to interpretation of the Bouguer anomaly: 1- Direct: The original data are analysed. 2- Indirect: models are constructed to compute theoretical gravity anomaly. High Gravity. Fault. Cavity. Ore. Actual Data. Theoretical model. High Gravity.

E N D
Interpretation Method: There are two approaches to interpretation of the Bouguer anomaly: 1- Direct: The original data are analysed. 2- Indirect: models are constructed to compute theoretical gravity anomaly. High Gravity Fault Cavity Ore Actual Data Theoretical model
High Gravity High Gravity Gravity Data display in two way: 1- As profiles; Has some charecteristic: A- Easley interpreted. B- Rapid C- Note more accurate. Bouguer Gravity Bouguer Anomaly Distance Distance 2- As map; Has some charecteristic: A- Need skill ness to interprete. B- Need more time C- More accurate. Bouguer gravity map Bouguer Anomaly map
High Gravity Bouguer Anomaly Distance Ambiguity in gravity interpretation: We have the following ambiguities: 1- The B.G or B.A at any station may represent superimposed effect of many mass distribution at various depths. Or we can say the B.G map is never a simple picture of a single isolated anomaly. B.G or B.A is a combination of : 1- Sharp anomaly. 2- Broad anomaly. Sharp Fault Ore body Broad Anticline
2- Determining the source from effect (it is more serious) . There are a large number of mass distribution produce the same effect. Bouguer Anomaly Distance 1 2 3 4
Bouguer Anomaly Bouguer Anomaly Distance Distance Shallow Structure Fault Residual Cavity Regional Deep Structure Fault Anticline
Regional and Residual Gravity: Regional: It is characterized by: 1- It is from large scale structure. 2- locate at great depth. 3- It is of long wave length. 4- Covers large distance. 5- It has large magnitude. 6- Vary slowly with distance. 7- Example: a- Basement b- Regional anticline. c- Petroleum traps. d- Deep seated faults. Regional and Residual Gravity: Residual: It is characterized by: 1- It is from small scale structure. 2- locate at small depth. 3- It is of short wave length. 4- Covers small distance. 5- It has small magnitude. 6- Vary greatly with distance. 7- Example: a- Shallow faults. b- small anticline. c- Cavity. d- Groundwater table.
Bouguer Gravity (500 Mgal) Residual Regional Bouguer Anomaly Bouguer Anomaly Distance A- Complex contour lines. B- Irregular. C- Space between lines are not equal D- Small magnitude (5 Mgal) A- Smooth contour lines. B- Parallel. C- Space between lines are equal D- Large magnitude (495 Mgal)
How we distinguish regional and residual: Residual Bouguer Anomaly Regional Distance Profile Map Example: 1- Ore body Residual Regional
2- Fault Bouguer Anomaly Residual Regional Method of Separation of Anomaly