Cosponsorship Data
330 likes | 437 Views
Explore network analysis of 280,000 proposed US bills from 1973-2004, uncovering cosponsorship patterns and legislative relationships. Learn about weighted cosponsorship distance, institutional & issue ties, and the impact on legislative influence and roll call votes.

Cosponsorship Data
E N D
Presentation Transcript
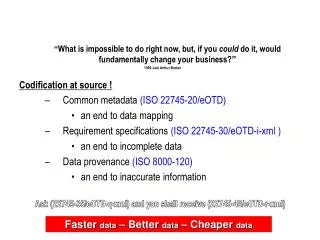
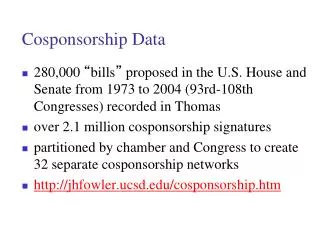
Cosponsorship Data • 280,000 “bills” proposed in the U.S. House and Senate from 1973 to 2004 (93rd-108th Congresses) recorded in Thomas • over 2.1 million cosponsorship signatures • partitioned by chamber and Congress to create 32 separate cosponsorship networks • http://jhfowler.ucsd.edu/cosponsorship.htm
Connectedness: An Alternative Measure • Traditional measures of centrality generate plausible names • None takes advantage of information about the strength of social relationships • Total number of cosponsors on each bill • Legislators recruit first those legislators to whom they are most closely connected. • More cosponsors = lower probability of direct connection • Bills with fewer total cosponsors more reliable • Strength of the connection between i and j = 1/cij • Total number of bills sponsored by j and cosponsored by i • More bills in common = stronger relationship • Weighted cosponsorship distance
Legislative connectedness • Suppose direct distance from legislator j to legislator i is simple inverse of the cosponsorship weight • Then use Dijkstra’s algorithm (Cormen et al. 2001) • Starting with legislator j, identify from a list of all other legislators the closest legislator i • Replace each of the distances with • Remove legislator i from the list and repeat until there are no more legislators on the list. Connectedness is the inverse of the average of these distances from all other legislators to legislator j.
Quality of Strongest Weighted Relationships • Institutional Ties • House committee chairs and ranking members • Senate majority and minority leaders • Regional Ties • From the same state • In the House they are often from contiguous districts • Issue Ties • Rep. Jim DeMint and Sue Myrick -- Republican Study Committee • Sen. George Mitchell and Jim Sasser -- Federal Housing Reform • Sen. Kay Bailey Hutchinson and Sam Brownback -- marriage penalty relief and bankruptcy reform • Personal Ties • Senator John McCain chaired Senator Phil Gramm’s 1996 Presidential campaign • McCain has told the media that they have been friends since 1982 when they served together in the House (McGrory 1995)
External Validity: Legislative Influence • Widely used measure of legislative influence is number of successful floor amendments • Hall 1992; Sinclair 1989; Smith 1989; Weingast 1991 • 1 SD increase in connectedness increases successful floor amendments • 53% in House • 65% in Senate
External Validity: Roll Call Votes • Model roll call votes as in Poole and Rosenthal, adding connectedness score of sponsor • 1 SD increase in connectedness of sponsor increases votes for bill by • 5.2 in House • 8.2 in Senate • 2 SD increase would change 16% of House votes and 20% of Senate votes
Modularity(Newman and Girvan 2004) Define modularity to be Q = (number of edges within groups) – (expected number within groups). Actual Number of Edges between i and j is Expected Number of Edges between i and j is
Modularity Matrix • So Q is a sum of over pairs (i, j) that are in the same group • Or we can write in matrix form as Where B is a new characteristic matrix, the modularity marix, (si, sj)
Modularity Matrix Algorithm • Calculate the leading eigenvector of the modularity matrix • Divide the vertices according to the signs of the elements Note that there is no need to forbid the solution with all the vertices in a single group.
Example Applications • Books on politics The vertices represent 105 recent books sold from Amazon.com Divide the books according to their political alignment Liberal / Conservative / Centrist