Download
1 / 66
660 likes | 694 Views
This presentation discusses Pennsylvania's PBIS structure, the rationale for universal screening of behavior, and the collaboration between PaPBIS, school districts, and university researchers. The study's lessons learned are also shared.

E N D
Universal Screening for Behavior: Pennsylvania’s Collaboration with Researchers and District Level Implementers’ Tina Lawson PaTTAN Kathleen Lynne Lane University of Kansas Wendy P. Oakes Arizona State University
Agenda • Define Pennsylvania’s PBIS Structure • Provide a Rationale for Universal Screening of Behavior • Define the Partnership between PaPBIS, School Districts, and the University Researchers • Define the Study • Share Lessons Learned
Participating Schools / LEAs Inclusive of both cohorts, all 29 Intermediate Units (IUs) have staff participating in the PAPBS Network as facilitators, consultants, etc.
PAPBS Network SWPBIS Sites – Cohort 1 (2007) &Cohort 2 (2009-present)
Prevalence Considerations Lane & Oakes
Student with Emotional and Behavioral Disorders (EBD) Externalizing Internalizing Lane & Oakes
Comprehensive, Integrated, Three-Tiered Model of Prevention (Lane, Kalberg, & Menzies, 2009) Goal: Reduce Harm Specialized Individual Systems for Students with High-Risk Goal: Reverse Harm Specialized Group Systems for Students At-Risk PBIS Framework Goal: Prevent Harm School/Classroom-Wide Systems for All Students, Staff, & Settings Validated Social Skills Program Behavioral Academic Social
(SRSS; Drummond, 1994) Student Risk Screening Scale
Student Risk Screening Scale (SRSS; Drummond, 1994) • The SRSS is 7-item mass screener used to identify students who are at risk for antisocial behavior. This tool is appealing to schools because it takes minimal teacher time and is of no cost. • Teachers evaluate each student on the following items - Steal - Low Academic Achievement - Lie, Cheat, Sneak - Negative Attitude - Behavior Problem - Aggressive Behavior - Peer Rejection • Each item is rated on a Likert-type scale of 0-3 • Never 0 • Occasionally 1 • Sometimes 2 • Frequently 3 • Student Risk is divided into 3 categories • Low 0 – 3 • Moderate 4 – 8 • High 9 – 21
Student Risk Screening Scale-IE Original SRSS-IE 14 12 items retained for use at the elementary level 14 items under development in middle and high schools (Lane, Oakes, Harris, Menzies, Cox, & Lambert, 2012)
(SSiS- PSG; Elliott & Gresham, 2007) Social Skills Improvement System – Performance Screening Guide
Social Skills Improvement System – Performance Screening Guide(SSiS- PSG; Elliott & Gresham, 2007)
SSiS– Performance Screening Guide • 4 items per student • Preschool Scale – 4-point Rubric • Elementary Scale – 5-point Rubric • Behavioral areas assessed • Prosocial Behavior • Motivation to Learn • Reading Skills (Early Reading Skills) • Math Skills (Early Math Skills)
SSiS – Performance Screening GuideRisk Categories • Preschool Scale Adequate Progress = 3 or 4 (green band) Moderate Risk = 2 (yellow band) Elevated Risk = 1 (red band) • Elementary Scale Adequate Performance = 4 or 5 (green band) Moderate Difficulties = 2 or 3 (yellow band) Significant Difficulty = 1 (red band)
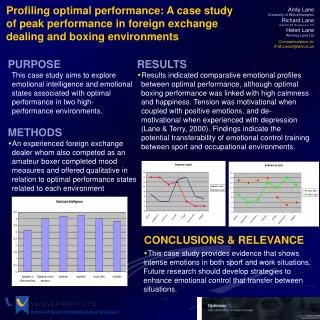
Report the findings of a psychometric study exploring reliability of the SRSS-IE in secondary schools • Report the convergent validity comparing scores two screening tools: the Student Risk Screening Scale – Internalizing and Externalizing (SRSS-IE) and the Social Skills Improvement System – Performance Screening Guide (SSiS-PSG; Elliott & Gresham, 2007). Purpose
Natural next step • Network Schools • Tier 1 with high fidelity • Advanced tier systems in place • Network Facilitators • Eligible Districts were close to a major airport • Kathleen and Wendy were interested!!!
METHOD A Look in School Secondary Schools
Table 1 Student and Teacher Characteristics Note. Percentages are based on the number of participants who completed the item.
Table 1 Student and Teacher Characteristics Note. Percentages are based on the number of participants who completed the item.
Table 1 cont. Student and Teacher Characteristics Note. Percentages are based on the number of participants who completed the item.
Table 1 cont. Student and Teacher Characteristics Note. Percentages are based on the number of participants who completed the item.
Table 1 cont. Student and Teacher Characteristics Note. Percentages are based on the number of participants who completed the item.
Table 1 cont. Student and Teacher Characteristics Note. Percentages are based on the number of participants who completed the item.
Table 2 School Characteristics 2010-2011
ProceduresStudy 1: Middle School & high school • Consenting Meetings • Completed two measures for one class period • SRSS-IE (10-15 min) • SSIS-PSG (30 min) • Social Validity • Data entry and reliability by research assistants
METHOD A Look in Elementary Schools
Table 1 Student and Teacher Characteristics
Table 1 Student and Teacher Characteristics
Table 1 cont. Student and Teacher Characteristics
Table 1 cont. Student and TeacherCharacteristics
Table 1 cont. Student and Teacher Characteristics Note. Percentages are based on the number of participants who completed the item.
Table 2 School Characteristics 2012-2013
Results Study 2: Elementary Schools
Table 3 Convergent Validity: SRSS-E7, SRSS-I5, and SRSS-IE12 with the SSiS-PSG
Table 4 Test-Retest Stability: SRSS-IE and SSiS-PSG
Social Validity – ES Teacher in Fall The greater differences appear to be related to: • SRSS-IE (a free-access screening tool) rated more favorably • Monetary resources (Cohen’s d = 1.40) as the primary concern • Easy to prepare (Cohen’s d = .73), SSiS-PSG to be better able to • cover the critical elements of behavior that concern teachers (Item 5; Cohen’s d = -.40), • offer teachers important information to support students (Item 6; Cohen’s d= -.46), and • offer the school as a whole important information (Item 7; Cohen’s d= -.46). Total social validity scores suggest a low-magnitude favorable rating for the SRSS-IE as whole relative to the SSiS-PSG. However, time, ease, and cost were the key factors; not utility.
District perspective • Administrative leadership both district and building level is critical • Convenience is KEY! • Faculty appreciated the ability to share perspectives through social validity survey • Faculty appreciated immediate feedback through electronic format • Participants needed frequent reminders of the conceptual purpose of Universal Screening • Consent • Follow up with plans for sustainability
SRSS-IE:SRSS-E7, SRSS-I5Cut Scores • Enter ‘practice’ data into that one sheet so that the total scores and conditional formatting are tested. • Items 1-7 (The SRSS externalizing scale) 0 – 3 low risk 4 – 8 moderate risk (yellow) 9 – 21 high risk (red) • Items 8-12 (The SRSS-IE internalizing items)*preliminary cut scores for elementary only 0 – 1 low risk 2 – 3 moderate (yellow) 4 – 15 high (red) Lane, K. L., Oakes, W. P., Swogger, E. D., Schatschneider, C., Menzies, H., M., & Sanchez, J. (in press). Student risk screening scale for internalizing and externalizing behaviors: Preliminary cut scores to support data-informed decision making. Behavioral Disorders
Sample … Winter SRSS-E7 Results – All Students N = 15 N = 66 N = 276
Sample … Winter SRSS-I5 Results – All Students N = 27 N = 48 N = 282