Download
1 / 36
360 likes | 511 Views
Hospital Discharge of Homeless Persons in Chicago. 2000 - 2006. National Alliance to End Homelessness Annual Conference 2006. Arturo Valdivia Bendixen Associate Director AIDS Foundation of Chicago abendixen@aidschicago.org. Presentation.

E N D
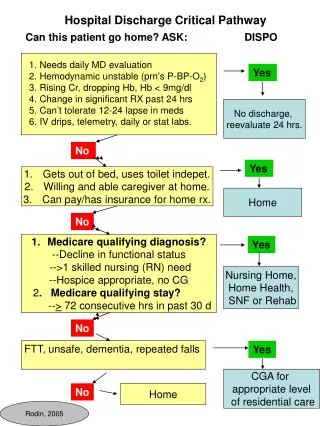
Hospital Discharge of Homeless Persons in Chicago 2000 - 2006
National Alliance to End Homelessness Annual Conference2006 Arturo Valdivia Bendixen Associate Director AIDS Foundation of Chicago abendixen@aidschicago.org
Presentation • The Interfaith House Experience • Snapshot Study of Cook County Hospital – 2006 • Integrating Systems of Care • The CHHP Experience
Interfaith House • 64 bed respite care facility • Hospital referrals from hospital discharge social workers • At capacity most of the time • 3 largest referral sources: - Cook County Hospital (Stroger) - Mt. Sinai Hospital - West Side VA Hospital
Study of Discharges to Respite CareDr. David Buchanan ServiceRespite CareUsual Group • Inpatient Days: mean: 3.4 mean: 8.1 • ER Visits: mean: 1.4 mean: 2.2 • Outpatient Vts: mean: 6.7 mean: 6.0
Hospital Discharges • Interfaith House • Variety of Shelters • Temporarily with family / friends • Some discharged to the streets • Some placed inappropriately at nursing homes
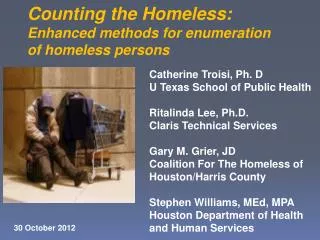
Prevalence of the Homelessat Cook County Hospital - 2006Dr. David Buchanan Snapshot of inpatients at hospital: • Homeless (HUD definition): 19.8% • Doubled-up homeless: 12.6% TOTAL: 32.4% • Mean duration of homelessness: 15.6 months
Homelessness = THE FAILURE OF MULTIPLE SYSTEMS OF CARE
Chicago Area • No tracking of the homeless at hospitals • No designated social workers to serve the homeless • Expedited hospital discharges often result in poor referrals and placements • Poor integration of hospital social services with shelter or housing systems
Organizational Partners • 3 Key Medical Centers / Hospitals • 11 Supportive Housing Providers • 3 Respite/Interim Housing Providers • 7+ Health Care Foundations • HUD / HOPWA
Client Partners • Adults who are homeless • In-patient at 3 area hospitals • At least 1 chronic medical illness • Willingness to give consent
4-Year Demonstration & Research ProjectSept. 2003 to Aug. 2007 First of Chicago’s Plan to End Homelessness
CHHP Project Design • Systems Integration - Council of Executive Directors - Oversight Committee of Directors - Systems Integration Team of Social Workers and Case Managers - Integrated Funding Opportunities
CHHP Project Design • Hospital • Respite Program • Permanent Housing
Systems Integration TeamServing theIntervention Group • Hospital: 2 case managers • Interim/Respite Housing: 3 case managers • Housing: 10 case managers • Coordination: 1 coordinator
Project Design - Housing • Supportive Housing – variety of models • Intensive Case Management – 10:1 ratio • “Housing First” approach • “Harm Reduction” models • Research Component
CHHP ParticipantsJune 30, 2006 – Final Enrollment • Intervention: 216 • Usual Care: 220 • TOTAL: 436
Intervention GroupEnrollment Began September 2003 Concluded May 2006
Intervention GroupGender – 216 Participants • Male: 74% - 159 participants • Female: 25% - 56 participants • Transgender: 1% - 1 participant
Intervention GroupAge – 216 Participants • 21 - 40: 30% - 64 participants • 41 - 60: 64% - 140 participants • 61 - 82: 6% - 12 participants • MEDIAN: 47 years
Intervention GroupRace/Ethnicity – 216 Participants • African A / Black: 77% - 166 participants • Hispanic / Latino: 8% - 17 participants • Caucasian / White: 10% - 22 participants • Other: 5% - 11 participants
Long-Term Homelessness216 Participants • Long-Term Homelessness (HUD) 151 participants - 70% • Short-Term Homelessness 65 participants - 30%
Substance Use History216 Participants • Assessed with Long Term History 153 participants - 71% • Estimated with Long-Term History 186 participants - 86%
Mental Illness History216 Participants • Diagnosed with Long Term History 67 participants - 31% • Estimated with Long-Term History 99 participants - 46%
Reached Stable HousingIntervention Group – 11/03 to 6/06 • 75% are reaching permanent housing • 60% are remaining housed for 1+ year
Housed Less Than 1 YearJune 2006 • 11 died in stable housing • 2 went nursing home (terminal illness) • 5 went to prison / jail • 13 lost housing – eviction, illegal or violent behavior
Reached Stable HousingIntervention Group – 11/03 to 6/06 Length of days to reach housing after hospital discharge- • Average: 76 days • Range: 70 – 90 days / {outliers: 0 – 371 days} • Median: 62 days
1+ Year HousedMISA Issues • Substance Use History – 60% • Mental Illness History – 10% • MISA History - 20%
Not Achieved Stable Housing25%Common Challenges • 50% disengaged after hospital discharge • Serious mental illness history with neuropsychiatry issues for some • Serious MISA histories • Felony histories – esp. sex offenders • Chronic illness complications – in nursing homes • Death before housing placement • Return to jail or prison
Preliminary OutcomesJune 2006 Nursing Home Days Intervention Group: • 2,146 days Usual Care Group: • 6,553 days
Preliminary OutcomesJune 2006 Emergency Room Visits Intervention Group • 2.5 times less (mean: 1.6) Usual Care Group • 2.5 times more (mean: 4.0)
Preliminary OutcomesJune 2006 Hospitalizations Intervention Group: • Mean: 1.5 Usual Care Group: • Mean: 2.3