Download
1 / 7
70 likes | 206 Views
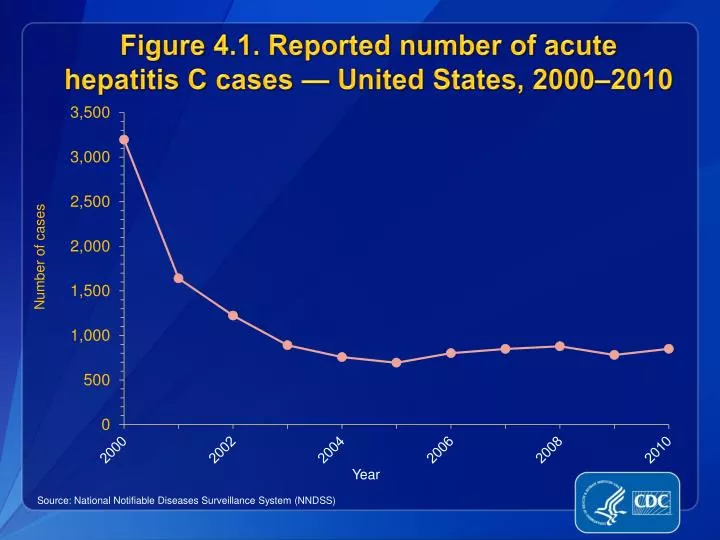
Figure 4.1. Reported number of acute hepatitis C cases — United States, 2000–2010. Source : National Notifiable Diseases Surveillance System (NNDSS). Figure 4.2. Incidence of acute hepatitis C, by age group — United States, 2000–2010.

E N D
Figure 4.1. Reported number of acutehepatitis C cases — United States, 2000–2010 Source: National Notifiable Diseases Surveillance System (NNDSS)
Figure 4.2. Incidence of acute hepatitis C, by age group — United States, 2000–2010 Source: National Notifiable Diseases Surveillance System (NNDSS)
Figure 4.3. Incidence of acute hepatitis C, by sex — United States, 2000–2010 Source: National Notifiable Diseases Surveillance System (NNDSS)
Figure 4.4. Incidence of acute hepatitis C, by race/ethnicity — United States, 2000–2010 Source: National Notifiable Diseases Surveillance System (NNDSS)
Figure 4.5. Distribution of risk exposures/behaviors associated with acute hepatitis C — United States, 2010 *Includes case reports indicating the presence of at least one of the following risks 6 weeks to 6 months prior to onset of acute, symptomatic hepatitis C: 1) using injection drugs; 2) having sexual contact with suspected/confirmed hepatitis C patient; 3) being a man who has sex with men; 4) having multiple sex partners concurrently; 5) having household contact with suspected/confirmed hepatitis C patient; 6) having had occupational exposure to blood; 7) being a hemodialysis patient; 8) having received a blood transfusion; 9) having sustained a percutaneous injury; and 10) having undergone surgery. Source: National Notifiable Diseases Surveillance System (NNDSS)
Figure 4.6a. Acute hepatitis C reports, by risk exposure† — United States, 2010 Number of cases *A total of 850 case reports of hepatitis C were received in 2010. †More than one risk exposure may be indicated on each case report. §Risk data not reported. Source: National Notifiable Diseases Surveillance System (NNDSS)
Figure 4.6b. Acute hepatitis C reports, by risk behavior† — United States, 2010 *A total of 850 case reports of hepatitis C were received in 2010. †More than one risk behavior may be indicated on each case report. §Risk data not reported. ¶A total of 454 hepatitis C cases were reported among males in 2010. Source: National Notifiable Diseases Surveillance System (NNDSS) Number of cases