Download
1 / 22
220 likes | 301 Views
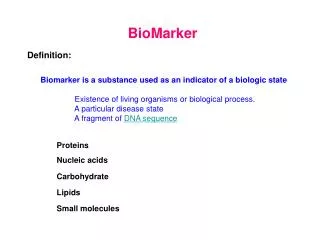
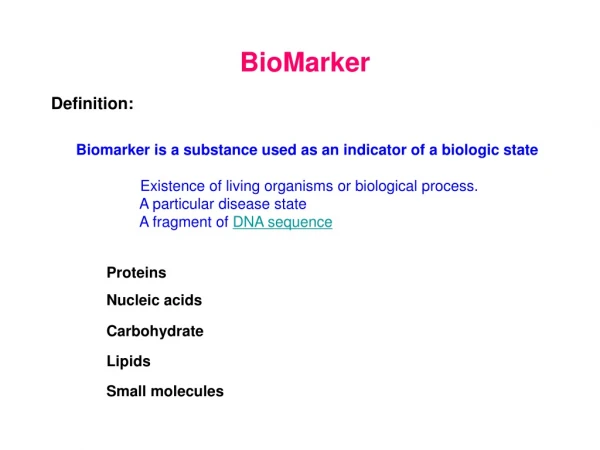
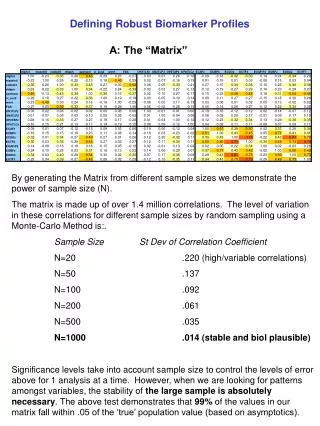
This study explores the power of sample size in generating a robust matrix of correlations to identify stable biomarker patterns. By comparing correlation variations, implications for error control and stability in large samples are discussed.

E N D
Defining Robust Biomarker Profiles A: The “Matrix” By generating the Matrix from different sample sizes we demonstrate the power of sample size (N). The matrix is made up of over 1.4 million correlations. The level of variation in these correlations for different sample sizes by random sampling using a Monte-Carlo Method is:. Sample Size St Dev of Correlation Coefficient N=20 .220 (high/variable correlations) N=50 .137 N=100 .092 N=200 .061 N=500 .035 N=1000 .014 (stable and biol plausible) Significance levels take into account sample size to control the levels of error above for 1 analysis at a time. However, when we are looking for patterns amongst variables, the stability of thelarge sample is absolutely necessary. The above test demonstrates that 99% of the values in our matrix fall within .05 of the ‘true’ population value (based on asymptotics).
N=20 N=50 N=200 N=1000
N=20 N=50 N=200 N=1000
N=20 N=50 N=200 N=1000
N=20 N=50 N=200 N=1000
N=20 N=50 N=200 N=1000
N=20 N=50 N=200 N=1000
N=20 N=50 N=200 N=1000
N=20 N=50 N=200 N=1000
N=20 N=50 N=200 N=1000
N=20 N=50 N=200 N=1000
N=20 N=50 N=200 N=1000
N=20 N=50 N=200 N=1000
N=20 N=50 N=200 N=1000
N=20 N=50 N=200 N=1000
N=20 N=50 N=200 N=1000
N=20 N=50 N=200 N=1000
N=20 N=50 N=200 N=1000
N=20 N=50 N=200 N=1000
N=20 N=50 N=200 N=1000
N=20 N=50 N=200 N=1000
N=20 N=50 N=200 N=1000