Download
1 / 12
120 likes | 178 Views
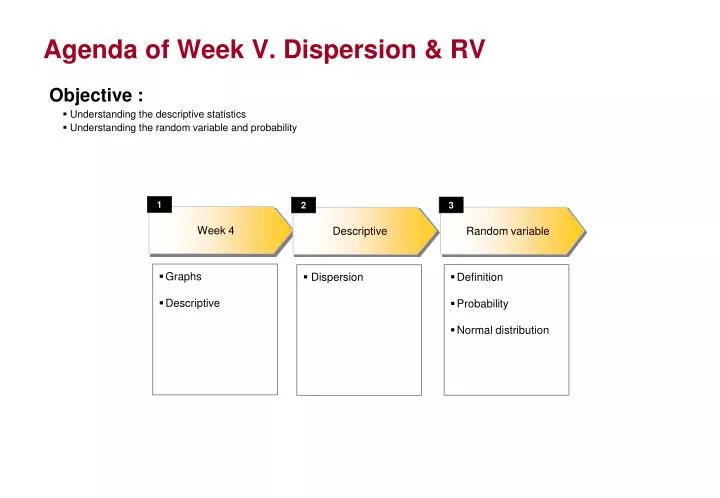
Agenda of Week V. Dispersion & RV. Objective : Understanding the descriptive statistics Understanding the random variable and probability. 1. 3. 2. Week 4. Random variable. Descriptive. Graphs Descriptive. Definition Probability Normal distribution. Dispersion.

E N D
Agenda of Week V. Dispersion & RV Objective : • Understanding the descriptive statistics • Understanding the random variable and probability 1 3 2 Week 4 Random variable Descriptive • Graphs • Descriptive • Definition • Probability • Normal distribution • Dispersion
Review of Week IV Objective : • Understanding the graphical illustration of data • Understanding the descriptive statistics 1 2 Graphs Descriptive • Definition • Types • Measurement • Central tendency • Dispersion
Dispersion • How varied are observations? • Table 4.9 • Range • Difference between the largest (maximum) and smallest (minimum) observations: Eq. 4.7 • Inter-quartile range: Figure 4.24 • Difference between the third and first quartiles • On box plot
Dispersion • Variance and Standard deviation • Average of the squared discrepancies of these values from their mean: Eq. 4.8, 4.9 • Characteristics: p.130 • Unbiasedness: Relation between population parameter and mean of corresponding statistics • Degree of freedom
Dispersion • MAD • Equation (4.14) • SPSS illustration • Table 4.3
Central Tendency vs. Dispersion • Bear Markets • P.131 • Table 4.11
Random Variable • Definition • A function that assigns a numerical value to each outcome in the sample space of a random experiment • Examples • Variable indicating the number of hits in at 5 bats • Variable indicating the number of red balls when we draw 3 balls from a bag with 3 blue balls and 2 red balls • Variable indicating the height of high school student
Random Variable • Discrete random variable • R.V. can have only discrete values (such as integers and natural numbers) as its values • Continuous random variable • R.V. can have continuous values or interval as its values
Probability • Definition • Possibility of happening a result from an event • P(X=a) = PX(a): Probability that result a happens • Properties
Probability Distribution • Role • Determination of probability for each value of r.v. • pdf. vs. cdf: Figure 6.5 • Expected value and Variance p.219 Example 6.3
Normal Distribution • Most broadly used distribution • Characteristics: Table 7.2 • pdf. and cdf.: Figure 7.7, 7.8 • A continuous scale • Clear central tendency • Tapering tails • Symmetric about the mean • Example: p.261
Normal Distribution • Importance • Parametrics vs. nonparametrics • Starting point of all kinds of statistics analyses • Normality test • Empirical rule • Figure 7.20