Download
1 / 23
240 likes | 362 Views
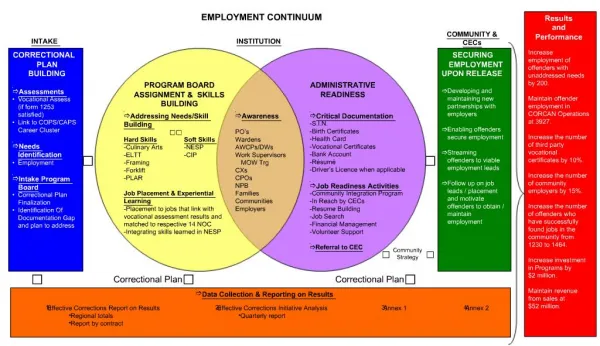
Employment and Training Administration Tracking the Service Continuum Pipeline. Participants. Development Activities. Skilled Workers. Tools for Case Managers and Supervisors. Today’s Objectives. Understand the service pipeline concept

E N D
Employment and Training AdministrationTracking the Service Continuum Pipeline Participants Development Activities SkilledWorkers Tools for Case Managers and Supervisors
Today’s Objectives • Understand the service pipeline concept • Understand the capabilities of the ETA Pipeline Analysis Software Program • Learn to use the Case Manager Tool
What is the Pipeline? • It is a formal and informal process with clear outer boundaries that direct the activities through which participants flow • Like water flowing through a pipe: • Pipe = Service Boundaries • Water = Participation • Connections = Logical points that direct participants to the next phase of the pipeline
Why Perform a Pipeline Analysis? Aids in assessing: • Gaps in service delivery • Case Manager performance • Level of engagement of participants • Program efficacy It provides a snapshot of participant and case manager progress and program effectiveness
Tracking the Service Continuum Pipeline: Three Tools • The Case Manager Tool • The Supervisor Tool • The Supervisor Longitudinal Tool
The Case Manager Tool Track progress of entire caseload Monitor progress of individual participants Generate charts and graphs to illustrate caseload status
The Case Manager Tool: Pipeline • PIPELINE COMPONENTS • Individualized Plan Review • Attendance • Pre-Placement Activities • Placement • Post-Placement Follow Up
The Supervisor Tool • Track multiple case managers’ progress • Monitor key program functions (e.g., placement) across case managers • Generate charts and graphs to illustrate monthly performance of multiple case managers
The Supervisor Longitudinal Tool • Track performance individual case manager over time • Generate longitudinal data on a case manager’s job performance • Generate charts and graphs to illustrate performance of a case manager over time
Case Manager Tool: Overview • 4 Worksheets: Action Codes, Pipeline, Rollup, and Graphs • Date-driven automatic calculations • Scoring of progress on 5 pipeline areas • Overall Progress Score
Pipeline Tool Focus Recruitment Enrollment Assessment Pre-Placement Activities Individualized Planning Placement Post-Placement Follow-Up & Support OVERALL PROGRESS SCORE Review – Assess – Adjust
Section 1: General Participant’s Information The tool automatically calculates the length of time each participant is in the pipeline.
Section 2: Individualized Plan Review The tool automatically calculates a score for the section based on dates entered.
Section 3: Attendance The tool automatically calculates a score for the section based on dates entered.
Section 4: Pre-Placement Activities Progress The tool automatically calculates a score for the section based on dates entered. The tool also calculates the # of days the participant has left to complete their activities.
Section 5: Placement Progress Rate The tool automatically calculates a score for the section based dates entered for PPA completion and/or placement.
Section 6: Placement Follow-Up Progress The tool automatically calculates a score for the section based on dates entered.
Section 8: Overall Progress Score The tool automatically calculates an overall score for each participant based on the lowest score from each of the section of the pipeline.
How to Find ETA Youth Services? Youth Services U.S. Department of Labor Office of Workforce Investment Employment and Training Administration youth.services@dol.gov (202) 693-3030 www.doleta.gov/youth_services