Download

1 / 17
170 likes | 278 Views
General equilibrium models for Norway and technological change - some lessons learned. Taran Fæhn, SSB Modellforum CenSES OG CREE 24. oktober i 2013. Background.

E N D
General equilibriummodels for Norway and technologicalchange- somelessonslearned Taran Fæhn, SSB Modellforum CenSES OG CREE 24. oktober i 2013
Background Traditional approaches to abatement costs overestimate the costs of climate policies - potential abatement options are omitted TOP-DOWN models – CGE (SSB’s MSG6) • Assume technologies of today (when calibrating) and of yesterday (when estimating) • Disregard most opportunities for future technologies • BOTTOM-UP models – e.g. MARKAL/TIMES: • Exogenous consumption and production patterns • Disregard most reallocations and interactions among factor and output markets Complement each other Iteration of integration are possible solutions
Studies of climate policies in presence of technological changeLessons from SSB analyses • Soft-linking MSG6 and MARKAL (Bjertnæs,Martinsen&Tsygankova 2013, Martinsen 2011) • Integrating technological information into MSG(-TECH) (Klimakur,2010; Fæhn&Jacobsen,2010) • Comparing MSG-TECH and bottom-up analyses (Fæhn,Gulbrandsen&Lindegaard,2010; Fæhn,Isaksen&Rosnes,2013) • Endogenising technological development (Bye&Jacobsen,2011; Heggedal&Jacobsen,2011) • Further plans
A. Soft-linking MGS6 and MARKAL Bjertnæs,Martinsen&Tsygankova (EnEco 39/2013) Martinsen (EnPol 2011) Analysis Designs: 1) Shiftedtheclimate policy (a uniform CO2tax) in MARKAL 2) Madethe same shift in MSG --------- 3a) AddedontoMSG’semissioneffectsthose from MARKAL • Total technology-inducedemissionreductions not dispersedonindustries 4a) Alsoinsertedannuitiesofinvestment and operationcostsinto MSG • Costsroughlyallocatedonindustriesbasedonemissions in thereference scenario and added to the input costs 5a) Studiedrevenues and recycling in the MSG modelwithnoiterations ---------- 3b) Feddemandresponses from MSG6 into MARKAL 4b) Re-simulatedthetaxshift in MARKAL-account for endo. demand
A. Soft-linking MGS6 and MARKAL Main lessons: • Planned to iterate all shifts, butretreated to two separate studies focussingon MSG and MARKAL, respectively (labour-consumingcommunication, solutions, many runs) • A considerablejob to match sectors and coherentreferencestates • Overlapping endogeneity (e.g. different endogenousel.pricemechanisms) -> iteration problems Easier to usethe inputs (beforethemodel’sendogeneity) than the outputs (aftersimulation) of MARKAL.
B. Integratingtechnologicalinformation into MSG(-TECH) Klimakur,2010(macroeconomic computations) Research question: Social abatement costs of meeting global, European and domestic emission caps within 2020 (Stortingetsklimaforlik) Analysis design: • Data on industry-specific technological options inserted in MSG-TECH for emission-intensive manufacturing, petroleum and road transport • MSG-TECH can endogenously determine what technology options are cost-effective for a given policy Conclusions: • Half of the abatement comes as investments in climate technologies • The rest results from down-scaling and reallocation of resources to other activities • The marginal abatement costs are relatively high (1500 kr/t)
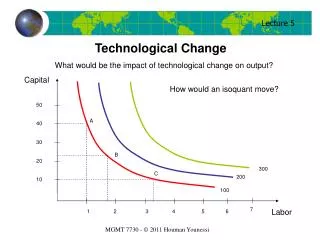
B. Integratingtechnologicalinformation into MSG(-TECH) illustration: Petroleum industry: The MSG adjustments: • Abatement curve= Relationship between accumulated abatement and marginal costs • Total abatement = abatement in the traditional model+resulting from climate technology inv. • Total abatement costs= integral above curve = added input costs in the industry (less efficient inputs) 10 detailed projects, types: Electrification Wind power installations Power efficiency improvements CCS The technological abatement curve
B. Integratingtechnologicalinformation into MSG(-TECH) : Fæhn og Jacobsen, 2010(ØA5 /2010) Research question: Allowing for technologicaladaptations The significance in terms ofabatementcosts Analysis design: Same domesticcap in MSG6 and MSG-TECH Conclusions: Marginal costs fall to 1/3 comparedwiththose in a traditional CGE modelwhenallowing for agents’ technologyoptions (in manufacturing, petroleum and road transport).
B. Integratingtechnologicalinformation into MSG(-TECH) Main lessons: • Able to placeeffectson real costs and emissions in the right industries • BUT: costsareallocatedoncomponents (inputs) according to original input structure, i.e. onlyrandomly a reasonablefit. Problem: wrong input marketimpact (egelectricitydemand from electrification) • Few “observations” in the estimations of abatement curves, particularly do we lack info on expensive techs - extrapolations • The points rely on absolute potentials guessed by experts. How absolute are these? Actually cost-dependant? • Continuous abatement curves -> Incremental abatement possible; putty-clay a better model for medium-term • Information continuously develop • Technology costs depend on time and policy regimes – learning (endo?)
C. ComparingMSG-TECH and bottom-up Fæhn,Gulbrandsen&Lindegaard,2010; (Smføk 5) Research question: Klimakur 2020 approachedthequestionofabatementcosts in two different ways – bottom-up and macroeconomicanalysis. Didtheanswerscoincide? Analysis design: Systematicidentificationofthe optimal abatementoptions in bothapproaches Conclusions: • The methodswerepartlycomplementary • Butalsopartly overlapping. Accounting for complementsbut not doublecountingoverlapsleftuswith a Climate Cure 20-30% cheaperthantheapproachesseparatelyfound • In addition: Manyoptionswere not included in any(e.g. agric) – and same withcosts (e.g. transition) – down or up?
C. ComparingMSG-TECH and bottom-up Fæhn,Gulbrandsen&Lindegaard,2010; Main lessons: • Hybrid modellingcanreachevenfurther - more technologyoptionsshould be considered (binding carbon, energyefficiency in buildings) • Problems: Manyoftheomittedoptionsare more thanfree. Need to solvethatpuzzle (omittedcosts?, marketfailures?, non-optimising agents?) • More reallocations shouldalso be considered (down-scalingof petroleum, agriculture, fishery – assumedunaffectednow)
C. ComparingMSG-TECH and bottom-up Fæhn, Isaksen&Rosnes; 2013 (SSB Report 39) Research question: Whatabatementwilltakeplace in Norway given a carbon price as in the 2 degree scenario Process: Studyinganswers from MSG-TECH and MARKAL/TIMES(IEA,2013) Reference=New policy scenario (current and expectedpolicies) Conclusion:
C. ComparingMSG-TECH and bottom-up Fæhn, Isaksen & Rosnes; 2013 Main lessons: • Otherabatementmeasuresthantechnologicaladaptationsaccount for 1/3 in MSG-TECH. Nevertheless, abatement is far more costly and less is implemented in MSG-TECH than in MARKAL/TIMES • MARKAL/TIMES considerably more technology-optimisticthan MSG-TECH Reasonable: • Cost (gu)esstimates in MSG-TECH aremade for 2020, and used unchanged for later periods • IEA looks at a global (not unilateral) implementation, whichwillspur R&D and learning - and costreductions But: • Costs in IEA arelowerthan in manyother studies of global implementation – also hybrid (NOU, 2012:16)
Endogenising technological development (Bye&Jacobsen,2011; Heggedal&Jacobsen,2011)Until now presented modelling of diffusion – the costs are exogenous, but diffusion endogenous Reasonable that technological development and cost reductions are endogenous in models of Norway? • Adaptation has local aspects – costs fall through learning (internalised or external effects?) • (Endogenous) absorptive capacity affect knowledge spillovers from abroad • Norway performs endogenous R&D We have modelled Norwegian R&D on CCS technologies og studied effects of public support and carbon pricing
From MSG-TECH to SNoW model StatisticsNorway’sWorldmodel Ambition: Make useofourlessonson hybrid modelling • Energy efficiency and marketimperfections • More realisticfactormarketimpacts • (Exogenous) technologydevelopment over time • Responsive output in petroleum, agriculture, fisheries • Dynamic (forward-looking) simulations (eg. Hyperbolicdiscounting) CGE modelfamily • World exogenous, MSG6-characteristics (SNoW-No) • World endogenous (global model) • SNoW-TECH (improved MSG-TECH characteristics) • Technologicaldevelopment (SNoW&ICE– InducedChange inEnergy technologies) SNoW-No under development • Why? • How? • How far have wegot?
Summing up: • Success of soft-link solutions more likely if both models operated by the same/closely collaborative teams • Hybrid models have become common • Norway has much expertise on climate technology details • There exists an optimum for how detailed a hybrid model should be – suitable for macro-economic problems • There is more potential in hybrid modelling • Energy efficiency, factor use, cost development over time….
Takk for oppmerksomheten tfn@ssb.no REFERANSER: Bjertnæs Tsygankova&Martinsen, 2013 Energy Economics 39, 147-58 Bye&Jacobsen, 2011 Energy Economics 33/3, 543-55 Fæhn Gulbrandsen&Lindegaard, 2010 Samfunnsøkonomen5, 4-15 Fæhn Isaksen& Rosnes, 2013 Rapporter 39, SSB Fæhn&Jacobsen, 2010 Økonomiske analyser 5, 11-16 Heggedal&Jacobsen, 2011 Resource&EnergyEconomics33/4,913-37 Klimakur2020, 2010 Rapport TA2590 KLIF (MDIR) Martinsen, 2011 Energy Policy 39/6, 3327-36