
Relationship Between Biological Repeats: Coefficiency Analysis in BTX623 Keller Plants
Explore the correlation coefficients between biological repeats in BTX623 Keller plants under normal and sucrose treatment conditions. Study includes microarray and qRT-PCR analysis, highlighting the reliability and repeatability of the data.

Relationship Between Biological Repeats: Coefficiency Analysis in BTX623 Keller Plants
E N D
Presentation Transcript
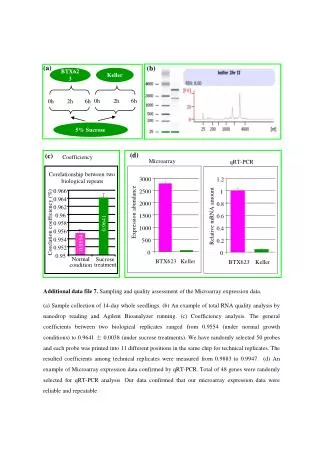
Corelationship between two biological repeats 0.966 0.964 0.962 0.96 0.9641 Corelation coefficiency (%) 0.958 0.956 0.9554 0.954 0.952 0.95 Normal Sucrose condition treatment (a) (b) BTX623 Keller 0h 2h 6h 0h 2h 6h 5% Sucrose (d) (c) Coefficiency Microarray qRT-PCR 3000 1.2 2500 1 2000 0.8 Expression abundance 1500 Relative mRNA amount 0.6 1000 0.4 500 0.2 0 0 BTX623 Keller BTX623 Keller Additional data file7. Sampling and quality assessment of the Microarray expression data. (a) Sample collection of 14-day whole seedlings. (b) An example of total RNA quality analysis by nanodrop reading and Agilent Bioanalyzer running. (c) Coefficiency analysis. The general coefficients between two biological replicates ranged from 0.9554 (under normal growth conditions) to 0.9641 ± 0.0038 (under sucrose treatments). We have randomly selected 50 probes and each probe was printed into 11 different positions in the same chip for technical replicates. The resulted coefficients among technical replicates were measured from 0.9883 to 0.9947. (d) An example of Microarray expression data confirmed by qRT-PCR. Total of 48 genes were randomly selected for qRT-PCR analysis. Our data confirmed that our microarray expression data were reliable and repeatable