Download

1 / 19
190 likes | 332 Views
Analysis of Variance ANOVA. Mary M. MacPhee Tuesday, October 23 rd , 2012. Two main types of statistical inference. Estimation with levels of confidence and confidence intervals Hypothesis testing using statistical significance / p -values (Vogt, p.130).

E N D
Analysis of VarianceANOVA Mary M. MacPhee Tuesday, October 23rd, 2012
Two main types of statistical inference • Estimation with levels of confidence and confidence intervals • Hypothesis testing using statistical significance /p-values (Vogt, p.130). Our purpose: use ANOVA or analysis of variance to test for statistically significant differences.
SPSS • Running ANOVA will give you P-value • & will compute confidence intervals • ANOVA is commonly used in Psychology and Educational research • ANOVA Infers back to the general population
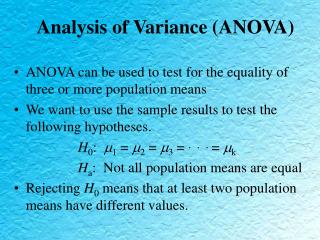
ANOVA analysis of variance • Tests for statistically significant differences between mean results of 2 or more groups. • There is a comparison or analysis • Differences or variances Between group means
Question we are asking • How much more variance or difference is there between groups than within groups?
Four Assumptions • Normal distribution within randomly chosen sample for DV • Homogeneity of variance (Levene’s) • Comparing independent cases • IV is categorical DV is quantitative
Homogeneity Assumption • Levene’stest for homogeneity • Higher than 0.05 (opposite to statistical significance),
When Assumptions Not Met • Welch or the Brown and Forsythe test. • Krusal- Wallis H test, (which is non-parametric, instead of using ANOVA, which is parametric) (LAERD).
Inferential statistics • F-test (ANOVA) • T2 = F • most widely used tests of statistical significance • yields p-value • 2-3 or more groups • Type 1 Error decreased • t-test • most widely used tests of statistical significance • yields p-value • 2 groups of cases
ANOVA • One-way ANOVA – 1 IV 3 or more independent groups • multifactor or factorial design: Two-way or Three-way ANOVA- 2 or 3 IV
Ratios • Between group difference Within group difference • MSeffectexplained variance MSerror unexplained variance
The big F • An omnibus test; if not which • The larger the F statistic • The more likely a statistically significant finding • Smaller F statistic, then null hypothesis • …no statistically significant difference between the group means can still be important!
Where is the difference? • Post-hoc, an a-posteriori (afterwards) test • Tukey HSD • Making multiple comparisons (Vogt, p.136)
Strengths • Robust against violations of assumptions • Reduces type I error compared to multiple t-tests • Ease of interpretation • Greater versatility than t-tests • Study multiple IV with multiple groups
Weaknesses • Requires approximately equal cell sizes (#). • Cannot be used to establish more complex models such as can be done with regression. • Requires post-hoc testing to tease out where the differences are.
Let’s do it • 1)bring up data • 2)click Analyze >> compare means > one way ANOVA • 3) drag and drop ( DV) into the dependent variable box • 4) drag and drop independent variable (status) into the factor box • 5)click Post Hoc and Tukey 6) click continue • 7)click options - descriptive & homogeneity variance • 8) continue – ok
Doing ANOVA /2 • Look at your descriptive statistics table, then go to multiple comparisons/ANOVA table • If statistically significant go to Tukey.
Graphing • Use bar chart with standard deviation bars for Graphing ANOVA ( LAERD)
References • Vogt, P. (2007). Quantitative Research Methods for Professionals. Boston, MA: Pearson. • Collican, H., (2004). Research Methods and Statistics in Psychology. (4th Ed.). London, UK: Hodder & Stoughton. • https://statistics.laerd.com/ • www.statsoft.com