
Objective
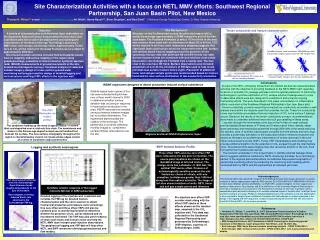
11m Massive Sand. ~200feet. Terrain conductivity and fracture characterization. 1.2 m shale beneath upper massive sand. 1.2m Shale. QuickBird fracture trace orientations along the west (left) and southeast (right) canyons near the new injection well. Henthorn, et al. (2007).

Objective
E N D
Presentation Transcript
11m Massive Sand ~200feet Terrain conductivity and fracture characterization 1.2 m shale beneath upper massive sand 1.2m Shale QuickBird fracture trace orientations along the west (left) and southeast (right) canyons near the new injection well. Henthorn, et al. (2007) Surface fracture trace orientations along the west (left) and southeast (right) canyons near the new injection well. Terrain conductivity response, PFC tracer and soil gas sampling locations San Juan Basin pilot site surface geology The sandstone holding up the mesa is approximately 11 meters thick and deposited over a relatively thin shale. The sandstones and shales in this Eocene age deposit extend several hundred feet beneath the surface. The near-surface stratigraphy throughout the region is characterized by canyon cut mesas whose edges consist of a series of sandstone steps and benches. Fast shear azimuth inferred from the Schlumberger Sonic Scanner trends roughly perpendicular to the axis of the basin. Rose diagram of drilling induced break outs observed in the Schlumberger FMI log. Synthetic seismic response of the logged intervals 300 feet to 2890 subsurface. Site Characterization Activities with a focus on NETL MMV efforts: Southwest Regional Partnership, San Juan Basin Pilot, New Mexico Thomas H. Wilson1,2 e-mail: tom.wilson@mail.wvu.edu; Art Wells1, Henry Rauch1,2, Brian Strazisar1, and Rod Diehl1 – 1) National Energy Technology Center; 2) West Virginia University Site Background Structure on the Fruitland coal across the pilot site (map at left) is nearly flat and dips approximately 0.25oNE toward the axis of the San Juan basin. The Fruitland Formation is about 175 feet thick in the area and contains three coals with net thickness of about 55 to 60 feet. CO2 will be injected in all three coals. Subsurface mapping suggests that significant faults and fracture zones are not present at the site. Surface and satellite based fracture mapping reveal the presence of two systematic fracture sets with dominant NE and NW trends (far right). Surface fracture trends are consistent with butt and face cleat trends observed in core through the Fruitland from a nearby well. The face cleat in the area have NE trend. Surface observations also included acquisition of over 50 line-kilometers of EM data used to help locate potential near-surface fracture zones (right). Placement of additional tracer and soil gas sample points was recommended based on fracture trend and the near-surface distribution of low-conductivity anomalies. Objective A variety of characterization activities have been undertaken on the Southwest Regional Carbon Sequestration Partnership’s San Juan Basin pilot site to aid in the deployment and subsequent interpretation of the National Energy Technology Laboratory’s MMV tracer and soil gas monitoring efforts. Approximately 75,000 tons of CO2 will be injected in the basal Fruitland coal at a depth of approximately 3500 feet. Site characterization activities included field and satellite based fracture mapping, subsurface mapping of the region using geophysical logs, evaluation of interferrometric synthetic aperture radar (INSAR) measurements of ground movements at the site, detailed electromagnetic surveys, lineament analysis of radar and Landsat imagery, design of a near-surface ground water monitoring well program and the design of detailed logging and vertical seismic profiling (VSP) efforts in the injection well. Conclusions As part of the NETL-University Consortium we initiated several site characterization activities with the objective of providing feedback to the NETL MMV team regarding locations of possible CO2 leakage pathways and the optimal placement of monitoring technologies to optimize estimation of CO2 escape volume if leakage were to occur. Collaborative efforts were also designed to compliment and enhance ongoing Partnership efforts. The work discussed in this paper concentrates on collaborative efforts conducted at the Southwest Regional Partnership’s San Juan Basin pilot. Terrain conductivity surveys reveal interconnected low conductivity anomalies in well drained areas within the massive sand that underlies the site. These low conductivity zones may facilitate groundwater flow and migration of CO2 to the surface if leakage occurs. Based on the results of the terrain conductivity surveys, recommendations were made to undertake additional tracer and soil gas sampling in these areas. Log data through the intermediate zone (top of the Fruitland to near-surface) provide detailed observations of P-wave and S-wave transit times, density, shear-wave anisotropy and mechanical properties through 2600 feet of the strata overlying the injection zone. A synthetic seismogram compiled from the density and sonic logs provides a preliminary simulation of the subsurface seismic reflection response and serves as the basis for a preliminary interpretation of events observed in the zero-offset vertical seismic profile (VSP). Future VSP interpretations and modeling may provide additional insights into the potential for CO2 escape through the intermediate zone. The planned time-lapse imaging may also reveal the position of the CO2 flood front within the Fruitland coal interval. The research undertaken in this project helps 1) identify potential leakage zones and 2) suggests additional locations for NETL monitoring activities. As a contributing partner in the regional partnership efforts our activities help expand outgrowths of partnership monitoring efforts by enhancing the monitoring and modeling efforts conducted both by NETL and the partnerships at individual pilot sites. INSAR experiment designed to detect production induced surface subsidence Satellite based radar scenes of the site were collected multiple times over a three month interval in 2006 to determine whether surface deflation was occurring in response to hydrocarbon production in the area. INSAR observations revealed strong coherence between images but no surface deformation. The experiment demonstrated the viability of the technique. The partnership is currently collecting monthly images to compliment surface tiltmeter observations over the site. Regional and local INSAR displacement maps SWP Vertical Seismic Profile Logging and synthetic seismogram Three offset VSPs and one zero offset VSP were collected at the site prior to injection. The source point locations are shown on the QuickBird image at left (red circles). The orange circle has a diameter of 1500 feet, the optimal VSP source offset. Presence of archaeologically sensitive areas at the site limited our choice of offsets, with one exception, to distances greater than 1500 feet along less than optimal azimuths. The image at left also shows locations of wells, NETL tracer and soil gas sample points and titlmeters Acknowledgements This technical effort was performed in support of the National Energy Technology Laboratory’s on-going research in carbon sequestration under the RDS contract DE-AC26-04NT41817-6060404000. We’d like to thank Dave Wildman and Donald Martello, our DOE-NETL project managers, for their support and advice on these efforts; Scott Reeves and Brian McPherson of the Southwest Regional Partnership for their help in facilitating our involvement in the Partnership’s activities on their San Juan Basin carbon sequestration pilot test and for allowing us to use data collected as part of the pilot effort; and Ryan Frost and Tom Cochrane of Conoco Phillips for helping facilitate many of the activities on the site. Appreciation is also extended to Dwight Peters and Marcia Coueslan with Schlumberger for critical assistance in the design of the logging and VSP acquisition, analysis and processing efforts at the site. We also want to thank Bill O’Doud (NETL) for his review comments. Detailed logging of the injection well is planned and includes the FMI log for detailed fracture characterization and the sonic scanner to obtain mechanical properties and measure sonic anisotropy. One zero offset and three offset VSPs will also be collected prior to and during injection to determine whether the presence of CO2 can be detected and its movements monitored. The VSP may also yield evidence of small scale faults and fracture zones and help the NETL MMV team interpret post-injection observations. The geophysical logging and VSP data will help other NETL and SWP researchers develop geomechanical and flow models. Pre-injection zero offset VSP corridor stack along with the offset CDP stacks at three offsets shown on the location map. acquired in the CO2 injection well. This data was collected for the Southwest Regional Partnership and processed by Schlumberger. (VSP displays, courtesy of Schlumberger, 2008). • References • Henthorn, B., Wilson, T., and Wells, A., 2007, Subsurface Characterization of a Carbon Sequestration Pilot Site: San Juan Basin, NM: Annual AAPG Convention, Proceedings CD. See also http://www.searchanddiscovery.net/documents/2007/07047henthorn /index.htm & http://www.geo.wvu.edu/~wilson/netl/ HenthornWilson&Wells -07AAPG.pdf • MDA Geospatial Services, 2007, Evaluation of InSAR technology for monitoring ground movement in New Mexico: report prepared for Tom Wilson, June 18, 2007, 23p. • Schlumberger, 2008, Sonic Scanner borehole anisotropy analysis – EPNG COM A ING 1. • Schlumberger, 2008, Vertical seismic profile – EPNG COM A ING 1 well, Z-axis processing and display.


