Download
1 / 30
300 likes | 475 Views
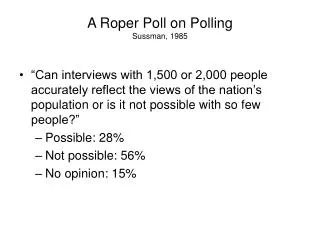
A Roper Poll on Polling Sussman, 1985. “Can interviews with 1,500 or 2,000 people accurately reflect the views of the nation’s population or is it not possible with so few people?” Possible: 28% Not possible: 56% No opinion: 15%. For in-class use. Write down questions you have about polling

E N D
A Roper Poll on PollingSussman, 1985 • “Can interviews with 1,500 or 2,000 people accurately reflect the views of the nation’s population or is it not possible with so few people?” • Possible: 28% • Not possible: 56% • No opinion: 15%
For in-class use • Write down questions you have about polling Consult your “neighbors” if you wish Bring along to the next class • Any questions except: how is it possible to represent a big country with only a thousand people (I’ll cover that) How polling is done (statistical questions) How polling is carried out (practical questions) Questions about the questions used in surveys About the use of polls About their honesty/meaningfulness About pres. polls; exit polls; questionable polls
Why take (sample) surveys? • Can’t afford to get information on entire population • Timeliness—survey data can be gathered quickly • Survey data is sometimes better than “hard” data (e.g., crime data) • Can get survey data on attitudes (and behavior that would be hard to observe)
A survey was even proposed to improve the decennial Census Survey limited areas for very-hard-to- reach individuals, extrapolate to other areas to arrive at more complete Census data • Scuttled by the Reps; it probably would have increased the count in Dem areas
Why study surveys(in this course)? • They are ubiquitous in politics Over 100 pre-election polls about the pres election (in one election year) Many more in gub, Sen, House races Constant barrage of poll data about issues Presidential approval is a standard news item (has been for 50 years)
Why study surveys (cont.) • Surveys/polls are not confined to politics More in marketing than elsewhere Mall intercept studies • Often well done; often not. You should be able to distinguish good from bad. • Even good surveys are hard to interpret; you should be able to do to
Basic terminology • Population: individuals that we wish to speak about Adults in the United States Likely voters in one state UR graduates, 1995-2004 • Sample: individuals we gather info from Individuals referred to as respondents
Basic idea of sampling: We extrapolate from a sample to a population We take a sample—usuallymuch smaller than the population—and make inferences about the population • Primary issues: How small or large a sample do we need? How do we sample (what individuals do we get information from)?
Nonprobability samples • Haphazard sample Sometimes called “random” • Purposive sample Select “representative” units • Quota sample Match population proportions (e.g., half women, half men in a national sample)
Problem with nonprobability samples: Can’t assess accuracy (no statistical basis) • Lots of bias likely to occur in sampling: Avoid certain parts of town Avoid hard-to-reach respondents British ex—interviews near tube stations Select cooperative respondents (big no-no) • Solution: use probability (random) samples
Probability samples • Simple random samples • Stratified random samples • Clustered random samples • Systematic random samples • Multi-stage random samples (combine elements of one or more of above)
Simple random samples • Definition Every element and every combination of elements has an equal chance of being selected; equivalently, every element has an equal chance of being selected and the selections are made independently. • Not true of all random samples We may have time to discuss; otherwise, see text.
Simple random samples • How can we represent so many with so few? • Intuitive idea (explained in class) • Formula for proportions (explained in class) The great simplification
Confidence intervals, different sized samples Confidence interval Sample size (+ or – this percent) 2000 2.2 1500 2.5 1000 3.1 500 4.4 200 6.9 Based on the assumption of srs; proportion of .50.
Other random samples • Most samples of people are not srs • One example only Stratify: divide the population in groups or areas; specify quotas; sample randomly within • Major reasons for using more complex samples: They are feasible, cheaper Significantly, and surprisingly, they are more accurate in some respects
A Famous FailureThe 1936 Literary Digest “Straw Poll” • Postcard “ballots” succeeded in predicting the winner in 1920, 24, 28, and 32 • 10m ballots sent out to addresses drawn from every phonebook in US, rosters of clubs (e.g., Auto), city directories, lists of voters, and mail order & occupational data. • 2.2m respondents predicting: • Alf Landon 57% • FDR 43% • On election day, FDR won by a landslide (62.5%, all but MN & VT) What went wrong??
Literary Digest v. George Gallup:“straw” meets “science” Some problems with the Literary Digest Straw Poll • Sampling bias. • Response Bias. • Time. Early September. • New Deal Coalition: class polarization • DO NOT LET RESPONDENTS SELF-SELECT! George Gallup got it right in 1936 using “quota sampling” • Interview a quota from each demographic group
Gallup Poll ResultsFinal poll (for winner) vs election • 1936 FDR -4.8 1972 RMN 1.3 • 1940 FDR -2.7 1976 JC -2.1 • 1944 FDR -2.1 1980 RR -3.8 • 1948 HST -5.1 1984 RR 0.2 • 1952 IKE -4.1 1988 GB 2.6 • 1956 IKE 1.9 1992 WJC 6.0 • 1960 JFK 1.1 1996 WJC 2.8 • 1964 LBJ 2.7 2000 GWB 0.1 • 1968 RMN -0.4 2004 GWB c2.0
Gallup Poll Results (cont.) • Averages • 1936-1948: 3.68 • 1952-1978: 1.94 • 1980-2004: 2.50 • Source: Election Polls: Elections 1936-2000 (Gallup Poll report) http://institution.gallup.com/content/default.aspx?ci=9448
Surveys today • Most are telephone surveys (since c1980) Use random digit dialing (RDD), not numbers from phone directories • Small, but increasing number are internet surveys Biggest promoter is Harris Interactive (Roch) Methods, validity still not fully accepted • Focus groups supplement surveys • Some nonscientific polls survive (be wary)
Problems with Public Opinion Polls • Occasionally people lie Rs don’t want to admit “unacceptable” behavior/attitudes Ex (1989): Gov. Wilder’s race in Virginia • Attitudes don’t always match behavior Example: 1930s study of hotels • Individuals often give ill-informed, inconsistent responses (next slides)
Ex: R’s are ill-informed • 1948 Socialist party’s presidential cand. 21% • 1966 Incum. House cand. in their district 46% • 1970 Know the pres is limited to two terms 67% • 1972 Know China to be communist 63% • 1977 Know meaning of no-fault insurance 31% • 1987 Can name Chief Justice of the SCt 8% • 1987 Know Bill of Rights is part of Const. 41% • The list could go on—and on • New study (1/31/05): 75% of high school students think flag-burning is illegal
Problems (cont.)Question wording matters • Do you think the United States should allow public speeches against democracy? • Do you think the United States should forbid public speeches against democracy? One might expect: % “allow” = % “don’t forbid”
Forbid/Don’t allow example (cont.) • Results of three surveys using these Q’s Public speeches against democracy Don’t Allow Forbid 1940 25 46 1974 56 72 1976 55 80
Problems (cont.)Question order/context can matter • Survey asked whether Soviet journalists should be allowed to move freely, report on U.S. (Result: low % yes) • Then asked, first, a question about U.S. journalists in the Soviet Union. (Result: Much higher % say Soviet journalists should be free in U.S.
Problems specifically of election polls • Predicting turnout Biggest problem • Undecideds A problem for low profile elections • Timing Early polls can be quite inaccurate Pollsters now work until election day.
Why believe polls? • With all these sources of error, how can we believe polls actually work? • With respect to technical matters: Polls match population data quite well. Repeated polls give consistent results. Polls do a good job—generally—of predicting elections (if not over- interpreted). Surely better than nonscientific methods
Why believe polls? (cont.) • With respect to substantive matters: Aggregate opinion is highly meaningful even if individual responses are problematic We can often identify, overcome biases Polls do a good job—generally—of predicting elections
Some “solutions” toproblems with polls • Look at multiple questions Attitudes: A chord, not a note • Be esp careful with controversial issues • Look at responses over time Changes are significant even if absolute level is not fully meaningful • Don’t over-interpret results (easy with presidential polls because a few % matter)