Download
1 / 68
680 likes | 1.03k Views
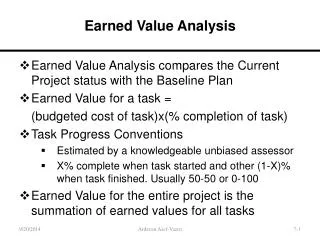
Analysis of Earned Value Data In Depth Training for EV Analysts. Eleanor Haupt ASC/FMCE. Questions to be Answered. PAST PRESENT FUTURE. Are we on schedule? Are we on cost? What are the significant variances? Why do we have variances?

E N D
AnalysisofEarned Value DataIn Depth Training for EV Analysts Eleanor Haupt ASC/FMCE
Questions to be Answered PAST PRESENT FUTURE Are we on schedule? Are we on cost? What are the significant variances? Why do we have variances? Who is responsible? What is the trend to date? When will we finish? What will it cost at the end? How can we control the trend? We analyze the past performance………to help us control the future
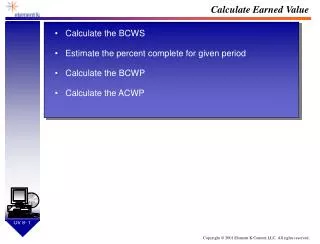
Analysis Roadmap • Validity check of data • Calculate variances • focus on significant variances • current or cumulative • Graph and analyze trends • Look at comparative data • Analysis of schedule trends, critical path • Examine written analysis by contractor • Look at work remaining versus risk in project • Solicit input from IPTs • Assess realism of contractor’s EAC • Calculate independent EAC • Formulate plan of action what are the drivers? what can we do about them?
Validity Check of Data • Elements on report should total properly • Total BAC should equal CBB (compare to contract) • Format 1 totals should match Format 2 totals • Refer to AFMCPAM 65-501 for further checklists • Are variances that meet the reporting threshold explained in Format 5? • For any element: • Is any negative data entered for BCWS, BCWP, ACWP? • should be explained in Format 5 • no negative data can be entered for BAC or LRE • Does ACWP exceed LRE? (should not) • If 100% complete, does LRE equal ACWP? (should) • Does BCWP or BCWS exceed BAC? (should not) • Is BAC or LRE equal 0? (should not) • Did BAC or LRE change from prior month? • if significant, look for explanation
Types of Variances • Values can be expressed as either current period or cumulative • current tends to be more volatile • use cum data to show trends • Easy rule of thumb: negative value = BAD positive value = GOOD index < 1.0 = BAD index > 1.0 = GOOD • Absolute • expressed in terms of dollars or hours (e.g., -$1,000) • may not be able to tell significance from this amount • Percent • relates absolute variance to a base (e.g., -35%) • shows significance • Index • compares one value to another in a simple ratio • if you are on plan, index = 1.00
Sample Data to Analyze Cumulative data
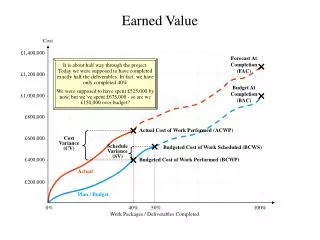
Schedule Variance ($) of the work I scheduled to have done, how much did I budget for it to cost? BC WS BC WP BUDGET BASED of the work I actually performed, how much did I budget for it to cost? SCHEDULE VARIANCE is the difference between work scheduled and work performed (expressed in terms of budget dollars) formula: SV $ = BCWP - BCWS example: SV = BCWP - BCWS = $1,800 - $2,000 SV= -$200 (negative = behind schedule) The computer has a schedule variance of -$200
Schedule Variance (%) Convert SCHEDULE VARIANCE to a percentage formula: SV % = BCWP - BCWS = SV$ BCWS BCWS example: SV % =- $200 = -10% $2,000 The computer has a schedule variance of -$200, which equates to -10%
Cost Variance ($) of the work I actually performed, how much did I budget for it to cost? BC WP AC WP PERFORMANCE BASED of the work I actually performed, how much did it actually cost? COST VARIANCE is the difference between budgeted cost and actual cost formula: CV $ = BCWP - ACWP example: CV = BCWP - ACWP = $1,800 - $1,900 CV= -$100 (negative = cost overrun) The computer has a cost variance of $-100
Cost Variance (%) Convert COST VARIANCE to a percentage: formula: CV % = BCWP - ACWP = CV $ BCWP BCWP example: CV % = -$100 = -6% $1,800 The computer has a cost variance of $-100, which equates to -6%
Price vs. Usage • In elements with a significant amount of recurring material, contractor should break CV $ into price vs. usage variance • problem: I used 10 more widgets than I planned on (58 - 68), and spent $30 more per unit than planned ($300 - $330) • Price variance = (price difference)*(actual number of units) = -$30 * 68 = -$2,040 • Usage variance = (usage difference)*(original price) = -10 * $300 = -$3,000 • Total cost variance = -$2,040 + - $3,000 = -$5,040 may also perform similar analysis for labor (labor rate vs. hours) or for overhead (rate vs. volume)
Variance at Completion (VAC) ($) B ACwhat the total job is supposed to cost E ACwhat the total job is expected to cost VARIANCE AT COMPLETIONis the difference between what the total job is supposed to cost and what the total job is now expected to cost. FORMULA: VAC $ = BAC - EAC Example: VAC $ = $4,000 - $4,500 VAC $ = - $500 (negative = projected overrun)
Variance at Completion (VAC) (%) Convert VARIANCE AT COMPLETION to a percentage: FORMULA: VAC % = BAC - EAC = VAC BAC BAC Example: VAC % = -$500 = -13% $4,000 The computer has a VAC of -$500, which equates to -13%
Management Reserve (MR) • If you expect the contractor to use all MR before the end of the contract: • add MR to BAC when calculating % complete, % spent, % scheduled • add MR to BAC when calculating statistical EACs • if you add it, be consistent and add to all formulas
A special note about Indirects • Typically, indirect loads (overheads, Gen & Admin, COM) make up 40 - 50% of a contract’s cost • To ignore the impact of these rates would be foolhardy • Understand the business assumptions that go into these rates • Have contractor perform rate vs. volume analysis • example: • Manufacturing overhead total CV: -$3,200K • impact due to actual rate -$ 500K • impact due to volume (loss of commercial business) -$2,700K • Have DCMC analyst support you with analysis of indirect variances • Assess impact of future rate changes on outyear costs
Performance Indices COST PERF INDEX (CPI) = BCWP ACWP SCHED PERF INDEX (SPI) = BCWP BCWS 1.2 “GOOD” 1.1 TIME 1.0 CPI .9 SPI “BAD” .8
Sample Data Indices CPI = $1,800 = .95 $1,900 SPI = $1,800 = .90 $2,000
Where are the significant variances? Worst SV ($): computer Worst SV (%): radar Worst CV ($): computer Worst CV (%): radar Worst VAC ($): computer, FLIR Worst VAC (%): FLIR
Sorting on Variances sorted by CV $ Analysis software tools (e.g. wInsight or Performance Analyzer) allow you to quickly sort on any column and spot the significant problems.
Guidelines • Start by looking at significant variances ($ and/or %) in CUM data • warning: cum data may mask recent negative variances • Don’t ignore the significant, positive variances • what is the explanation? • example: the contractor took earnings for material (BCWP), but the actuals (ACWP) have not yet hit. This variance would reverse itself in the next cycle. • Look at CURRENT period variances • can indicate start of trend, or significant change • example: element may still have a positive CUM variance, but the current period data shows a significant negative variance • Variances that are very early (<5% complete) may be misleading • How do I know if it is serious? • variance greater than +/-10% • sudden trend change • analysis software will flag serious variances for explanation
Additional screening hints • BCWR • Budgeted Cost of Work Remaining (BCWR) = BAC - BCWP • calculated automatically by software • shows if there is a significant amount of work remaining or not • companion check: percent complete • Use BCWR and % Complete to screen out elements that are very close to finishing, are too early to look at, or elements that are too minor • examples: • example 1: BCWR is $2K, % complete is 55% TOO MINOR • example 2: BCWR is $100K, % complete is 97% TOO CLOSE TO END • example 3: BCWR is $2,400K, % complete is 2% TOO EARLY, BUT WATCH • example 4: BCWR is $2,000K, % complete is 38% LOOK AT VARIANCES • Focus your analysis efforts on significant elements
Tips for Trend Analysis Cum charts show overall trend... are you getting better, or worse? Current charts show the months where there were significant performance problems.
Total Program Variances Analysis:Both cost and schedule trends have been negative for several months, and declined this month. Contractor is 33% complete. Management Reserve is .4M (2% of PMB). Contractor expects to finish on budget (0% VAC). Program Office expects -2.2 VAC, or -11%, and expects cost performance to decline.
Trend Chart for Elements Analysis: Cost: this element experienced significant cost problems in Aug, Oct, Nov. Shows some recovery, but still a serious cost variance. Reason why: Schedule: this element showed early schedule problems, but recovered and was significantly ahead of schedule in Oct. Recent performance has declined and now slightly behind schedule. Why: VAC: Contractor revised (decreased) LRE in Nov and claims only -3% at complete. DOESN’T MATCH COST PERFORMANCE.
Show performance against technical performance Is there a correlation between technical performance and earned value performance? Can poor technical performance be used to predict schedule and cost problems? Use appropriate trend data. What is technical driver that would drive performance data?
EAC Realism Shows changes in BAC and LRE. Compares budget vs. contractor’s LRE. Software calculates EAC based on cum CPI. Compare this to the LRE.Analysis: contractor increased the budget for this element twice. Contractor also increased the LRE twice, but NOT AS MUCH as the BAC. Based on past performance as reflected in the Cum CPI forecast for EAC, the contractor’s LRE is UNREALISTIC.
Keep an eye on Management Reserve Compare MR changes to cost variances. CAUTION: MR should not be applied to offset cost variances. Both MR and UB should be explained in Format 5.
Schedule Status % scheduled = BCWS x 100% = 2,000 = 50% BAC 4,000 % completed = BCWP x 100% = 1,800 = 45% BAC 4,000 compare I should have completed 50% of the total work. I only completed 45% of the total work.
Budget Status budget status % spent (original budget) = ACWP x 100% BAC compare: % spent vs. % complete example: 48% spent vs. 45% complete
Compare CV to VAC Example 1: CV -6% VAC -13% Example 2: CV -15% VAC -8% Example 3: CV -12% VAC -12% I project that performance will get worse and result in a bigger overrun I project that performance will get better. I’ll have better cost efficiencies in the future than I do now. I project that performance will stay the same
Compare color coding • Compare color coding for CV versus VAC. • Flag all elements for further analysis that rate CV a different color than VAC, but especially those with a red CV and green VAC. • Elements with a red SV coding and green CV coding may indicate an emerging problem. note: software allows you to establish color thresholds.
Schedule Analysis • Early warning: schedule variances are usually an early warning of cost variances to follow • Schedule variances in EVMS should be seen as indicators and warnings • True schedule analysis should be performed on the integrated master schedule • Analysis of critical path activity • Work with program office schedule analyst • Performance data and formal schedule should indicate same problems and risk areas • Some software allows you to synch the master schedule and performance data for an integrated assessment
TIME NOW BCWS BCWP MONTHS BEHIND Converting SV $ to Months Either technique can be used to convert SV from dollars to approximate months. Note that this is dependent on average of work scheduled and is only an approximation. Draw a parallel line from BCWP back to intersect BCWS, then drop down to read off the X axis (time). Months ahead or behind = SV $ Average monthly BCWS $
Variance Explanations • Format 5 variance analysis should address: • separate discussion of CV, SV (current and cum) and VAC • clear description of reason for variance • quantity variances (e.g., price vs. usage) • be specific, not general • corrective action • technical, schedule, and cost impacts • impact to estimate at completion • should be written by CAM! A big hammer for a big variance!
Significant Variances • What is a significant variance? • % variance (e.g., >10%) • $ variance (e.g., >$50,000) • critical path element • risk/complexity • impact to other elements • Top 10, Top 20, etc. • contractor defined
Need to look ahead Format 5 Narrative Report Element Code: 25 Project Officer: BUETTGENBACH Element Name: AVIONICS IPT Office Symbol: 25 Schedule Variance: Month: $0K Avionics is essentially on schedule. Cumulative: ($54K) Cumulative negative variance is due to the following. ………… GCAM, Robert Gemin, 6 Oct. 97 I consider this month's assessment accurate and complete. Looking forward one could expect additional variances for the following reasons: SV may increase temporary due to late delivery of... … SV will still appear for the upcoming months. CV will increase in the upcoming month for two reasons. … .. excerpts from actual analysis…. Contractor was incurring relatively small variances, but the government manager saw risks ahead
Look Ahead • Government control account managers (GCAMs) should keep up to date on what the PMB looks like for their element • “IBR” should be seen as continuous process • Continue the dialogue with contractor counterparts • Sample: • “I know that we failed the reliability test this month. What impact will this have on the remaining schedule and budget?” • Don’t wait until the formal report is received • GCAMs are the technical managers, and understand the nature of the technical risks ahead • Are developing problems in the performance report analyzed and included in the formal risk plan? • Are items in the formal risk plan analyzed for cost and schedule impacts? • Are highly probable risk elements included in the EAC? • Is the system engineer evaluating the integration of all elements? • Program office may wish to perform a formal Integrated Risk Assessment on the program
Analysis within the Program Office • Assign to technical managers within program offices • Government Control Account managers (GCAMs) • Conduct monthly team variance meetings • Open, honest communication essential • Oral, e-mail, and face-to-face discussions • Continuing dialogue dramatically improves Format 5 • Early warning analysis • Top level cost and schedule analysis by EVMS and schedule analysts • analysts should actively seek input from IPTs • CAM/GCAM analysis at lowest level • analysis should be loaded into network for availability to entire team • Work closely with DCMC team • Share results of analysis with contractor
Program Manager Ownership • Program managers/IPT leads should be able to access complete data base from their desk • typical question: “What is this trend telling me?” • PMs go directly to CAMs/GCAMs for details • program managers should focus on significant trends • program managers should receive EVMS training • Program managers chair variance analysis meetings • not a financial function • should lead dialogue with contractor • EVMS metrics should be fully integrated into program reviews • internal to company • to government program office experience shows…. if a program manager shows that he uses EVMS to manage, then the IPTs will follow. It is very difficult for the IPTs to maintain interest on a long term basis without this leadership.
What will be the final cost? • Estimate at Completion (EAC) • defined as actual cost to date + estimated cost of work remaining • contractor develops comprehensive EAC at least annually • reported by WBS in cost performance report • should examine on monthly basis • consider the following in EAC generation • performance to date • impact of approved corrective action plans • known/anticipated downstream problems • best estimate of the cost to complete remaining work • also called latest revised estimate (LRE), indicated final cost, etc. • ACWP + ETC = EAC