Download
1 / 24
240 likes | 382 Views
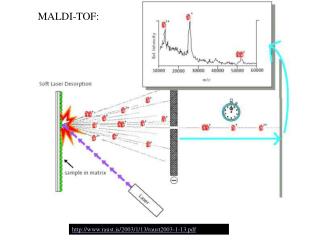
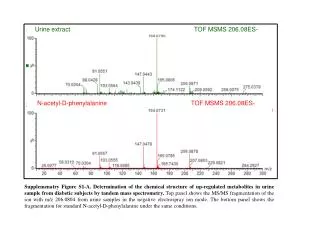
Urine extract TOF MSMS 206.08ES-. N-acetyl-D-phenylalanine TOF MSMS 206.08ES-.

E N D
Urine extract TOF MSMS 206.08ES- N-acetyl-D-phenylalanine TOF MSMS 206.08ES- Supplemenatry Figure S1-A. Determination of the chemical structure of up-regulated metabolites in urine sample from diabetic subjects by tandem mass spectrometry. Top panel shows the MS/MS fragmentation of the ion with m/z 206.0804 from urine samples in the negative electrospray ion mode. The bottom panel shows the fragmentation for standard N-acetyl-D-phenylalanine under the same conditions.
Urine extract TOF MSMS 101.03ES- 2-Ketobutyric acid TOF MSMS 101.03ES- Supplementary Figure S1-B.Determination of the chemical structure of down regulated metabolite in urine samples of diabetic subject by tandem mass spectrometry. Top Panel shows the MS/MS fragmentation of the ion with m/z 101.03 from urine extract in the negative ion mode. The bottom panel shows the fragmentation for standard 2-Ketobutyric acid under the same conditions.
Urine extract TOF MSMS 145.02ES- 2-Ketoglutaric acid TOF MSMS 145.02ES- Supplementary Figure S1-C.Determination of the chemical structure of down regulated metabolite in urine samples of Diabetic subject by tandem mass spectrometry. Top Panel shows the MS/MS fragmentation of the ion with m/z 145.02 from urine extract in the negative ion mode. The bottom panel shows the fragmentation for standard 2-Ketoglutaric acid under the same conditions.
Urine extract TOF MSMS 168.08 ES- 1-Methylhistidine TOF MSMS 168.08 ES- Supplementary Figure S1-D.Determination of the chemical structure of down regulated metabolite in urine samples of Diabetic subject by tandem mass spectrometry. Top Panel shows the MS/MS fragmentation of the ion with m/z 168.08 from urine extract in the negative ion mode. The bottom panel shows the fragmentation for standard 1-Methylhistidine under the same conditions.
Urine extract TOF MSMS 188.04 ES- Kynurenic acid TOF MSMS 188.04 ES- Supplementary Figure S1-E.Determination of the chemical structure of down regulated metabolite in plasma samples of Diabetic subject by tandem mass spectrometry. Top Panel shows the MS/MS fragmentation of the ion with m/z 188.04 from urine extract in the negative ion mode. The bottom panel shows the fragmentation for standard Kynurenic acid under the same conditions.
Urine extract TOF MSMS 206.08ES- Xanthurenic acid TOF MSMS 206.08ES- Supplementary Figure S1-F.Determination of the chemical structure of down regulated metabolite in plasma samples of Diabetic subject by tandem mass spectrometry. Top Panel shows the MS/MS fragmentation of the ion with m/z 206.08 from urine extract in the positive ion mode. The bottom panel shows the fragmentation for standard Xanthurenic acid under the same conditions.
Plasma extract TOF MSMS 124.02ES- Taurine TOF MSMS 124.02ES- Supplementary Figure S1-G :Determination of the chemical structure of down regulated metabolite in plasma samples of Diabetic subject by tandem mass spectrometry. Top Panel shows the MS/MS fragmentation of the ion with m/z 124.02 from plasma extract in the negative ion mode. The bottom panel shows the fragmentation for standard Taurine under the same conditions.
Plasma extract TOF MSMS 167.03ES- Uric acid TOF MSMS 167.03ES- Supplementary Figure S1-H.Determination of the chemical structure of down regulated metabolite in plasma samples of Diabetic subject by tandem mass spectrometry. Top Panel shows the MS/MS fragmentation of the ion with m/z 167.03 from urine extract in the negative ion mode. The bottom panel shows the fragmentation for standard Uric acid under the same conditions.
Plasma extract TOF MSMS 267.07ES- • Inosine TOF MSMS 267.07ES- Supplementary Figure S1-I.Determination of the chemical structure of downregulated metabolite in plasma samples of Diabetic subject by tandem mass spectrometry. Top Panel shows the MS/MS fragmentation of the ion with m/z 267.07 from plasma extract in the negative ion mode. The bottom panel shows the fragmentation for standard Inosine under the same conditions.
Supplementary Figure S1-J.Determination of the chemical structure of upegulated metabolite in urine samples of Diabetic subject by tandem mass spectrometry. Top Panel shows the MS/MS fragmentation of the ion with m/z 177.10 from plasma extract in the positive ion mode. The bottom panel shows the fragmentation for standard Serotonin under the same conditions.
Supplementary Figure S1-K.Determination of the chemical structure of upregulated metabolite in plasma samples of Diabetic subject by tandem mass spectrometry. Top Panel shows the MS/MS fragmentation of the ion with m/z 87.00 from urine extract in the negative ion mode. The bottom panel shows the fragmentation for standard Pyruvic acid under the same conditions.
Supplementary Figure S1-K.Determination of the chemical structure of upregulated metabolite in plasma samples of Diabetic subject by tandem mass spectrometry. Top Panel shows the MS/MS fragmentation of the ion with m/z 130.08 from urine extract in the negative ion mode. The bottom panel shows the fragmentation for standard Leucine under the same conditions.
Supplementary Figure S1-L.Determination of the chemical structure of up-regulated metabolite in plasma samples of by tandem mass spectrometry. Top Panel shows the MS/MS fragmentation of the ion with m/z 380.2552 from plasma extract in the positive ion mode. The bottom panel shows the fragmentation for standard Sphingosine-1-phosphate under the same conditions.
Supplementary Figure S1-M.Determination of the chemical structure of downregulated metabolite in plasma samples by tandem mass spectrometry. Top Panel shows the MS/MS fragmentation of the ion with m/z 117.0189 from plasma extract in the positive ion mode. The bottom panel shows the fragmentation for standard Succinate under the same conditions.
Supplementary Figure S1-N.Determination of the chemical structure of upegulated metabolite in plasma samples of Diabetic subjects by tandem mass spectrometry and matching the fragments with standard fragmentation patern . The top panel shows the fragmentation for standard PC(18:0/0:0) taken from Lipid maps. The bottom panel shows the MS/MS fragmentation of the ion with m/z 524.37 from plasma extract in the positive ion mode.
Supplementary Figure S1-O.Determination of the chemical structure of down regulated metabolite in plasma samples via tandem mass spectrometry. The top panel shows the fragmentation for standard PE(P-16:0/22:6). The bottom panel shows the MS/MS fragmentation of the ion with m/z 746.51 from plasma extract in the negative ion mode.
Supplementary Figure S1-P.Determination of the chemical structure of up-regulated metabolite in plasma samples by tandem mass spectrometry. The top panel shows the fragmentation for standard PG(18:0/18:1) taken from Lipid maps. The bottom panel shows the MS/MS fragmentation of the ion with m/z 775.54 from plasma extract in the negative ion mode.
Supplementary Table ST1. UPLC-MRM-MS Parameters used for quantitative measurement of metabolites in plasma and urine samples. Metabolites were quantified using Multiple reaction monitoring (MRM) on a triple quadrupole mass spectrometer (Xevo TQ, Waters). For each metabolite, a MRM method was optimized using the “IntelliStart” function on the Xevo TQ for determining the optimal cone voltages, collision energy and dwell time for maximal sensitivity and ion transmission for the selection of Q1/Q3 transitions.
Supplementary Table ST2. UPLC-MRM-MS Parameters of stable-isotope-labeled standards used for SID-MRM-MS in plasma and urine samples. For each metabolite, a MRM method was optimized using the “IntelliStart” function on the Xevo TQ for determining the optimal cone voltages, collision energy and dwell time for maximal sensitivity and ion transmission.
Supplementary Figure S2. Multiple reaction monitoring yields ion traces of stable isotope labeled and unlabeled metabolites that show retention time reproducibility. The urine and plasma samples were processed by spiking a known concentration of the stable isotope labeled metabolites and injected for UPLC-SID-MRM-MS analysis as described in the Methods section. MRM runs were performed by monitoring Q1/Q3 transitions. The peak area of the endogenous metabolite was normalized to that of the respective isotope labeled standard and the relative ratios in T2DM and controls were calculated.
B A T2DM Control T2DM Control Supplementary figure S3. Random forests analysis of T2DM and Control subjects. Panel A: Heat map visualization of the top 50 features rankings comparing relative levels in control and T2DM in plasma samples. Panel B. Heatmap of the top 50 features in urine samples. Each row represents a unique feature with a characteristic mass to charge and retention time (minutes).
Supplementary Table ST3: Unidentified putative markers of diabetes
Supplementary Figure S4. KEGG pathway for tryptophan metabolism. Functional pathway analysis for changes in metabolite levels in diabetes revealed tryptophan metabolism to be one of the major pathways involved with a significant representation of metabolites participating in this pathway. (Green: down-regulated in diabetes; Red: up-regulated in diabetes)
(T2DM) (Control) Supplementary Figure S5: OPLSDA plot generated for the nine target metabolites.