Download
1 / 12
170 likes | 484 Views
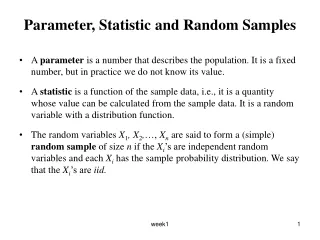
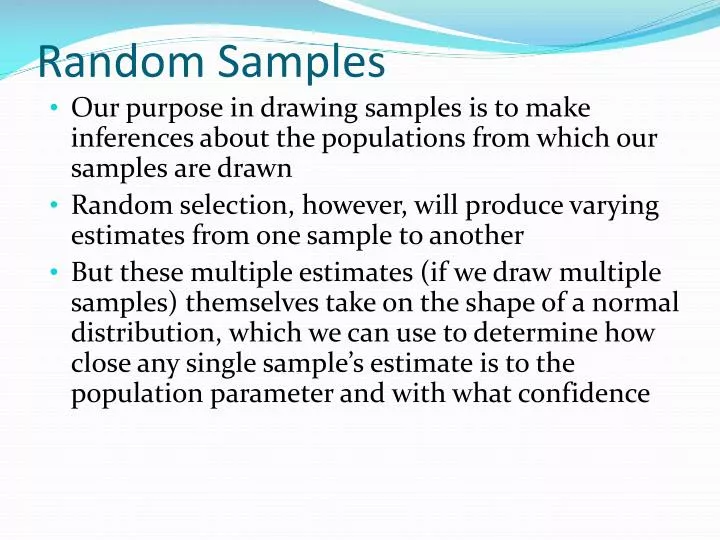
Random Samples. Our purpose in drawing samples is to make inferences about the populations from which our samples are drawn Random selection, however, will produce varying estimates from one sample to another

E N D
Random Samples • Our purpose in drawing samples is to make inferences about the populations from which our samples are drawn • Random selection, however, will produce varying estimates from one sample to another • But these multiple estimates (if we draw multiple samples) themselves take on the shape of a normal distribution, which we can use to determine how close any single sample’s estimate is to the population parameter and with what confidence
Randomization, response bias, and sampling bias: a famous example Literary Digest mailed 10 million surveys in 1936 and asked whether respondents planned to vote for Alfred Landon or FDR for president. Received 2.4 million replies Predicted results: Landon would receive 52% of popular vote and 370 vs. 161 electoral votes for FDR
The 1936 Election Results Electoral College Votes Landon FDR Literary Digest Predict’n 370 161 Actual results 8 523 What went wrong here?
1936 Literary Digest Survey • Response bias: 24% completion rate • Sampling bias: • Lists to whom surveys were sent included: • Subscribers to Literary Digest Magazine • Car registration records • Telephone owners • The probabilities of poorer folks being in the sample were much less than wealthy ones and socioeconomic class was highly related to the predicted behavior (vote for FDR)
Additional wonders of random samples • if you sampled the same population many, many times, your results would be distributed normally. This is called the sampling distribution. (2) the larger your sample, the greater your chances that your estimate will come close to the true value in the population from which you sampled (3) The “real” population mean will fall within + or - one s.e. of your sample estimate of the mean in 68% of these repeated samples (95% will fall within + or - 2 s.e.)
Confidence Intervals Inferential Statistics
The standard error (s.e.) The standard error is to the sampling distribution as the standard deviation is to an estimate from a single sample They are mathematically related: s.e. = s.d. √n The distinction between s.d. and s.e. is really key to understanding statistical inference.
Any estimatefrom a random sample has a confidence interval Q. What is it? • The range within which a statistic is expected to fall if we drew repeated samples of same size and design from the population To calculate a 95% c.i.: ¯ 1.96 s.d./√n This is the standard error (s.e.)
Your turn…find confidence interval • Come up with examples of your own, using both population parameters and sample statistics( ie. population standard deviation is unknown) And then construct confidence intervals at both 95% and 99% intervals.
In other words, any estimatefrom a random sample has a confidence interval Q. What is it? • The range within which you can be confident to find the true population parameter in, say, 95 of 100 repeated samples of same size and design from the population To calculate a 95% c.i.: ¯ 1.96 s.d./√n