Download
1 / 57
580 likes | 798 Views
Colloquium Bioinformatics and Computational Biology Systems Biology George Mason University September 24 th , 2013. Meta-analysis of genetic associations using knowledge representation J. Enrique Herrera- Galeano Jeff Solka. Outline. 1. Background 2. The problem &

E N D
Colloquium Bioinformatics and Computational Biology Systems Biology George Mason University September 24th, 2013 Meta-analysis of genetic associations using knowledge representationJ. Enrique Herrera-GaleanoJeff Solka
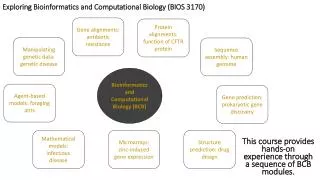
Outline 1. Background 2. The problem & 3. Motivating examples 4. Results 5. OGA application Hypothesis
Genetics • Hippocrates (460-370 BC), Celsus (25 BC-50 AD), and Galen (130-201 AD) Description of the Human body Mendel distinguished between internal state (genotype) and the external stage (phenotype) Mendelianinheritance, biochemical pathway defects, metabolic disorders Phenylketonuria- Described by IvarAsbjørnFøllingIn 1934 is a good example of a disorder caused by as single mutation Autosomalrecesive
<do> add gene </do> • <do> add SNP </do> • This caused the search for the gene for everything
Genetic epidemiology • Segregation analysis = analysis of pedigrees • PCR 1980’s Short tandem repeats (STRs) Highly polymorphic and neutral to selection Whole Genome Mapping (WGM) or Linkage analysis 1990’s linkage of Breast Cancer to Chromosome 17q (D17S588 and D17S250)
Not as simple • Janine Altmüller in 2001 best summarized these observations by stating “Positional cloning based on whole-genome screens in complex human disease has proved more difficult than originally had been envisioned…” (Altmüller, 2001)
Candidate Gene Approach • 1990’s Due to the limited success of WGM Take all the genes associated with the phenotype by different methods, find polymorphisms, genotype. • 2000’s Human genome Sequencing -> SNPs Illumina Golden Gate array - Thousand of SNPs – Hundreds of Genes - SNP selection problem (NP complete)
Candidate Gene Approach Metropolis monte Carlo markov chain Min(σ(distanace) * The probability of a SNP being real p = 0.3L + 0.2H + 0.2S + 0.1M + 0.1V, where L = Illumina score H = heterozygosity (from dbSNP) S = success rate (from dbSNP), M = 1 if present as tag SNP in the HapMap, or zero if not, V = the number of validation sources/10. Herrera-Galeano, 2008
Candidate Gene Approach Example: • PEAR1 Herrera-Galeano, ATVB 2008
Complex Human Disease Neurological abnormalities: Schizophrenia, depression High Blood pressure LDL cholesterol Height Weight BMI Vp = Vg + Ve Vp = Phenotypic variance Vg = Genetic variance Ve = Environmental variance Heritability in the broad sense H = Vg/Vp (Falconer, 1993)
Genome Wide association (GWAS) • High Density arrays now allowed for millions of SNPs, left behind SNP selection. • Missing Heritability
GWAS • Solutions to the missing heritability problem: Epigenomics, other omics… Epistatic effect: 1. Map/reduce for cloud brute force (Wang, 2011) 2. Random handfuls ( Province, 2008) 3. Machine learning (Lin, 2012) 4. Information theory (Lee, 2012)
The problem/hypothesis • All of these focus on the search space of the genotypes the relationships of phenotypes currently unutilized • Are closely related phenotypes associated to the same genes? • What methodology can be utilized to answer such a question?
GWAS General Well Being QTL clearly related to Mental disorders, what if a related SNP was associated with a related phenotype
Ontologies and Genetic association • Requirements : • Phenotype ontology Human Phenotype Ontology (HPO) Robinson (2010) • Database of Genetic associations (NCBI Genetic Association Database)
Ontologies and Genetic association Columbia Medical Entity Dictionary (MED) -A semantic network from ICD-10, SNOMED, UMLS Is-a relationship
Linking HOP with GAD • How to match the ontology concepts with the genetic association database entries? Overlapping matching sets: Concepts that match Coronary Artery Disease Artery Coronary Disease
Linking HOP with GAD Pattern matching: Find string s in text T Finite-state automaton (grep) Blast Suffix tree/array
Linking HOP with GAD Suffix array: One common word: percentage of assignment (41.1% vs. 27.5%) error rate 30% , one sample n=1,000 Complete string matching: percentage of assignment 19%, error rate ~2% on 5 samples of n=1000
OGA: Ontology of Genetic Associations • Allows for answering questions such as: • What Genes are associated with Mental Disorder? • What is the intersection of genes between two or more phenotypes of interest?
Observed count of phenotypes per gene : Mental Disorder Concept
Phenotypes count found by chance? • Empirical p-value Empirical p-value = 1 / sumi=1..n(C'i)
OGA preliminary stats GAD has 84,558 entries 23,303 unique matches (27.5%) SLC6A4 -> 20 phenotypes 178 iterations p-value = 0.0056 NOS1 -> 16 phenotypes 41 iterations p-value = 0.02 All other > 0.05 SLC6A4, MAOA, NOS1, NOS2A and NOS3
INFORMATION NETWORK Oxidase MAOA NOS1, NOS2A SLC6A4 Regulates Degrades SEROTONIN Antioxidants and depression?
Motivating examples Colon cancer and Helicobacter pylori infection susceptibility Lipid metabolism, diabetes, obesity, and hypertension Schizophrenia, bulimia, depression and psychosis Autism and Cerebral palsy
Motivating examples Colon cancer and Helicobacter pylori infection susceptibility Strofilas et al., 2012 Colon cancer & H. pylori infection O'Donoghue, 2011 CYP2C19 and H. pylori Yamamoto et al., 2013 CYP2C19 and cancer CYP2C19 is the gene symbol for the Cytochrome P450, family 2, subfamily C, polypeptide 19 gene
Motivating examples 2. Lipid metabolism, diabetes, obesity, and hypertension