Download
1 / 25
260 likes | 453 Views
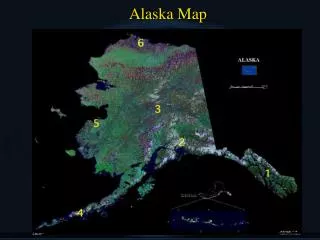
Maximum Sustainable Yield: A Fiscal Road Map for Alaska. University of Alaska Budget Committee Fairbanks, Alaska August 8, 2013 Scott Goldsmith Institute of Social and Economic Research University of Alaska Anchorage With Generous Financial Support From.

E N D
Maximum Sustainable Yield:A Fiscal Road Map for Alaska University of Alaska Budget Committee Fairbanks, Alaska August 8, 2013 Scott Goldsmith Institute of Social and Economic Research University of Alaska Anchorage With Generous Financial Support From
DOR Projected Petroleum Revenues Fall 2012 (before SB21) – 5% Real Decline Rate
Non-Petroleum Strategies for the Future? • Natural Resource Development • Value Added Processing • Economic Diversification • Infrastructure Investments in Power and Transportation • Footloose Industry • Renewable Energy
Replace $7.5 Billion in Petroleum Revenue with Taxes on Other Resources $10,000 / OZ. GOLD $50 / SALMON $5,000 / TOURIST *Estimate for FY 2011
10 Year Fiscal Plan: Judicious Use of Reserves ? $3 $400 million in 2013, $700 million in 2014
Wellhead Values: Oil vs Gas Tax Base $3.8 $17.2 Gas Pipeline @ 3.5 bcf Oil Pipeline @ 500k
How Can We Sustain a Healthy Level of Public Services in the Future? MAXIMUM SUSTAINABLE YIELD Management of our biggest asset—Petroleum. How Big is Our Nest Egg? How Should We Manage It? How Should We Spend it?
HOW BIG IS THE NEST EGG? $200,000 for each current resident
HOW SHOULD WE MANAGE THE NEST EGG (Asset, Endowment)? For Maximum Long Run Return
DRAW each year at a rate that will conserve the value of the Nest Egg for future generations of Alaskans—the Maximum Sustainable Yield. HOW MUCH OF THE NEST EGG SHOULD WE SPEND?
Maximum Sustainable Yield: Mechanics (2013) NEST EGG $4.5 $7.3 Oil & Gas Revenue Financial Earnings Nest Egg Cash Flow Saving & Reinvestment 4% Draw $6 $5.8 Total Maximum Sustainable Yield $6
Maximum Sustainable Yield:Disposition (2013) Total Maximum Sustainable Yield $6 $5 $1 GF Non Petroleum Revenues General Fund Permanent Fund Dividend $.5 $5 $5.5 GENERAL FUND MAXIMUM SUSTAINABLE YIELD
Maximum Sustainable Yield: Nest Egg Growth
FY 13 & 14 General Fund Spending (Billion $) * Sustainable with income and sales taxes.
Maximum Sustainable Yield:A Fiscal Road Map for Alaska University of Alaska Budget Committee Fairbanks, Alaska August 8, 2013 Scott Goldsmith Institute of Social and Economic Research University of Alaska Anchorage With Generous Financial Support From