Explaining Santa Maria ISD’s Financial Position
90 likes | 204 Views
Detailed breakdown of Santa Maria ISD’s financial status and performance metrics presented at a council meeting, including budget, revenue, expenditures, teacher data, and academic achievements.

Explaining Santa Maria ISD’s Financial Position
E N D
Presentation Transcript
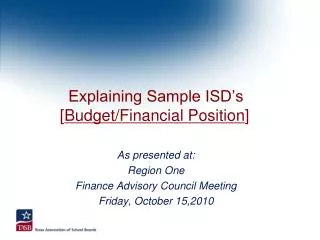
Explaining Sample ISD’s [Budget/Financial Position] As presented at: Region One Finance Advisory Council Meeting Friday, October 15,2010
Our Students • Santa Maria ISD serves 647 students __% White 100% Hispanic __% African American __% Asian/Pacific Islander __% Native American __% Limited English Proficient __% Economically Disadvantaged __% Special Education
Our Academic Achievement • District’s State Rating is Academically Acceptable 25 % of campuses are rated “Recognized” 50 % of campuses are rated “Academically Acceptable” 25 % of campuses are rated “Other” • Our district did “Meet AYP” • Graduation rate is 86.7% vs. state average of 79.1 % • 2006-07 Dropout rate (9th -12th grade) 3.4% vs. state average of 2.2 %
Our Teachers • 41.3 % of our teachers have 1-5 years of experience • 17.4 % of our teachers have 11+ years • Average beginning teacher salary is [$33,949] in our district and $34,252 statewide • Average teacher salary is [$42,064] in our district and $47,305 statewide • Average student/teacher ratio 14.5 to 1 • 4.7% of our employees are “Administrators”
An Overview of Our Financial Position • During the 2008-09 school year, we spent $7,967 per student • That amounts to [$_____] per student per hour • Our total operating costs were $ 7,372,378
Sample ISD’s Expenditures • Operating Expenditures 48 % on Instruction 6.0 % on Administration (school and district) 2.0 % on Transportation 5.0 % on Food Services 12.0 % on Utilities • 22 % increase in operating expenditures since 2005-06
Sample ISD’s Revenue • Sources • % Local ($6.4) • % State ($70.5) • % Federal ($23.1) • Total Revenue is $ 7,939,963
Sample ISD’s Financial Position • Revenue – Expenditures • Proposed budget foresees revenues of $6,940,435 and expenditures of $6,287,998 • Balanced or Surplus Budget • What about upcoming years? • Deficit Budget • Did you have to use your fund balance?
Sample ISD’s Tax Rate • The district’s current M&O tax rate is $1.04 • The proposed M&O tax rate is $1.28 • The total tax rate (M&O and I&S) is $ 1.551 • This is expected to generate $497,605 over the next school year.