Download
1 / 16
160 likes | 266 Views
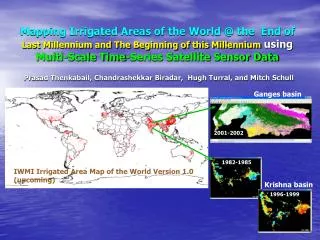
Mapping Irrigated Areas of the World @ the End of Last Millennium and The Beginning of this Millennium using Multi-Scale Time-Series Satellite Sensor Data. Ganges basin. 2001-2002. Prasad Thenkabail, Chandrashekkar Biradar, Hugh Turral, and Mitch Schull. 1982-1985.

E N D
Mapping Irrigated Areas of the World @ the End ofLast Millennium and The Beginning of this Millennium using Multi-Scale Time-Series Satellite Sensor Data Ganges basin 2001-2002 Prasad Thenkabail, Chandrashekkar Biradar, Hugh Turral, and Mitch Schull 1982-1985 IWMI Irrigated Area Map of the World Version 1.0 (upcoming) Krishna basin 1996-1999
Map Irrigated Areas of the World @ 1 to 10-km scale • 2. Map Irrigated areas of selected River Basins @ 500-m scale Mapping Irrigated Areas of the World Overarching Goals In Segments IWMI Irrigated Area Map of the World Version Beta (upcoming) Annual Rainfall <36 cm Ganges IWMI Ganges Kassel/FAO
Key Achievements and Knowledge Generation http://www.iwmidsp.org/
Global irrigated area maps and characteristicsVersion 1.0 of IWMI (release November end, 2004) • 1-10 km resolution • Characteristics of irrigated area classes • 2. River basin Irrigated area maps and characteristics of IWMI (available online: www.iwmidsp.org) • 500m -10-km resolution • Ganges and Krishna basins • Accuracy assessments • Comparisons with USGS, GLC, National Census, and kassel • Advanced methods and techniques • A number of advanced innovative methods and techniques (e.g., hyperspectral, quantitative spectral matching) used will be discussed in 3-4 papers in pipeline for year 2005. • 4.Online access to IWMI’s Data and Knowledge on irrigated areas • Primary data used in the project is made available globally through online access • Irrigated area maps and characteristicsmade available globally through online access Mapping Irrigated Areas of the World @ IWMIKey Achievements
IWMI Irrigated Area Map of the World Version 1.0 (upcoming) Irrigated Areas @ 1-10 km Only irrigated area shown above; de-highlighting all other classes shown below Zoom into Irrigated Areas @ 150-m Snap-shot of Irrigated Areas @ 150-m
Dynamic Irrigated Area Maps and Characteristics Example: Krishna River Basin AVHRR NDVI, Monthly, 1982-1985 AVHRR NDVI, Monthly, 1997-1999 Very Slow: 10fps
How Does it Compare with Others? http://www.iwmidsp.org/
Global Map of Irrigated Areas, Indo-Ganges (500m, IWMI, 2004) Irri: Rice, sugarcane Irri: Rice, sugarcane Irri: Other crops, fallow Irri: Water logged crop Irri: Rice with wetlands Irri: Rice & other crops 33.1 Mha Irrigated Note: 12.3 Mha rainfed + supplemental Irri. (not in image) 500-m MODIS Total study area: 133 Mha Global Map of Irrigated Areas (.5 degree, Kassel / FAO, 2001) 31.2 Mha Irrigated 50-km Digitized from maps, various sources from Nations
Irrigated Area Map (Kassel/FAO) Differences in Irrigated Area Mapping Irrigated Area Map (IWMI) IWMI Percent Irrigated: < 0.1 or null Landsat Geocover 2000 image Irrigated: Rice/Sugarcane Kassel Irrigated: Other crops Truth
Ganges River Basin Irrigated Areas from Different RS Studies Ganges-Classification Irrigated area deviation from this study (also includes rainfed with suppl.) USGS (1992-1993) 32,255,630 (ha) 16.6 (%) less than ours GLC (2000) 56,466,954 (ha) 33.4 (%) more than ours IWMI (2001-2002) 37,602,567 (ha) This study (irrigated + supplemental) IWMI (2001-2002) 26,873,934 (ha) This study (irrigated pure) Change in a decade is 16.6 % additional area (taking IWMI irrigated + supplemental). USGS (1993) Just look in Ganges area GLC has 2 irrigated area classes class 32 and 33. Class 33 in actual is a mix of rainfed and supplemental. IWMI (2004) GLC (2000)
Source Level Scale or resolution Spatial Map Remarks 1.0 Irrigated Area Mapping IWMI (2004-05) Global 1-10 km yes Work in progress. Multi scale satellite sensor data, temporal, DEM, rainfall, and other secondary datasets River basins 500-m yes MODIS data for Krishna and Ganges Kassel/FAO Global 50-km Yes National Statistics and Maps 2.0 LULC Mapping (deriving “rough estimates” of irrigated areas from indirect means) FAO Global various No From National census datasets GLC2000 Global 1-km yes SPOT Vegetation data @ 1-km USGS (1992-93) Global 1-km yes AVHRR 1992-93 data 3.0 National Efforts (Note: has gone into Kassel/FAO effort) Individual Countries National various No National census data Mapping Irrigated Areas of the WorldIWMI vs. Others IWMI Irrigated Area Mapping Advances: (a) first RS/GIS based work @ Global level (thereby consistent set of indicators for entire World), (b) the best spatial scale so far from any sources @ Global level, and (c) in methods and techniques.
Use of Irrigated area Information http://www.iwmidsp.org/
1. GPG, CP, IWMI researchera. filling information gap b. providing consistent information c. Mapping baseline conditions Mapping Irrigated Areas of the World Use Data and Knowledge 2. Inputs to Global models a. Area irrigated b. Spatial distribution of irrigated c. Dominant crops in each irrigated classes d. Intensity of irrigation (% irri. in a pixel) for each month e. Characteristics of irrigated classes a. Green up b. Green peak c. Amplitude d. Magnitude e. Biomass accumulation f. single, double, continuous cropping 3. Capacity for other Global work @ IWMIa. Wetlands of the World b. GW studies in the region c. Water productivity estimations in river basins
Where do we go from here? http://www.iwmidsp.org/
Global irrigated area map of the World @ 1-10 km Version 2.0 • Evaluations and consultations on version 1.0 • Improvements to version 1.0, release of version 2.0 (e.g., major crop groups) • Comprehensive characteristics of irrigated area classes (e.g., irrigation intensity) • Animations and behavior of irrigated areas over time and space • Accuracy assessment • Comparison with National statistics and/or with other studies and/or ground truth • Wide dissemination • 2. Global irrigated area mapping @ 30 to 150-m scale • 2005 completion and release of version 1.0 • 2006 write up and release of version 2.0 • ………………Budget for 2005 is 275k including staff time (1 full time RS expert, 2 part time RS experts, 1 senior researcher for 6 months, 1 month of principal scientist, data, software, hardware); 2006 the budget will be 200k. • Online access to IWMI’s Data and Knowledge on irrigated areas Mapping Irrigated Areas of the World Where do We Go From Here