Understanding Randomness
Understanding Randomness . Chapter 11. Objectives. Random Generating random numbers Simulation Simulation component Trial Response variable. Why Be Random?. What is it about chance outcomes being random that makes random selection seem fair? Two things:

Understanding Randomness
E N D
Presentation Transcript
Understanding Randomness Chapter 11
Objectives • Random • Generating random numbers • Simulation • Simulation component • Trial • Response variable
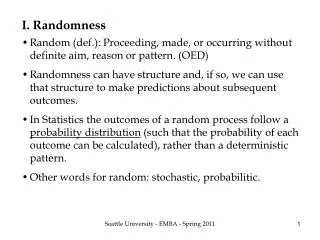
Why Be Random? • What is it about chance outcomes being random that makes random selection seem fair? Two things: • Nobody can guess the outcome before it happens. • When we want things to be fair, usually some underlying set of outcomes will be equally likely (although in many games some combinations of outcomes are more likely than others).
Why Be Random? • Example: • Pick “heads” or “tails.” • Flip a fair coin. Does the outcome match your choice? Did you know before flipping the coin whether or not it would match? • You can’t predict how a fair coin will land on any single toss, but you’re pretty confident that if you flipped it a thousands of times you’d see about 50% heads.
Why Be Random? • Randomness is not always what we might think of as “at random.” • Random outcomes have a lot of structure, especially when viewed in the long run. • Truly random values are surprisingly hard to get. • On the next slide, look at the numbers quickly and pick a number at random.
What did you pick? • Almost 75% of all people pick the number 3. • About 20% pick 2 or 4. • Only about 5% choose 1.
Why Be Random? • Statisticians don’t think of randomness as the annoying tendency of things to be unpredictable or haphazard. • Statisticians use randomness as a tool. • But, truly random values are surprisingly hard to get…
It’s Not Easy Being Random • It’s surprisingly difficult to generate random values even when they’re equally likely. • Computers have become a popular way to generate random numbers. • Even though they often do much better than humans, computers can’t generate truly random numbers either. • Since computers follow programs, the “random” numbers we get from computers are really pseudorandom. • Fortunately, pseudorandom values are good enough for most purposes.
Does shuffling cards make the deck random? • It depends on the number of shuffles. • How many times should you shuffle cards to make the deck random? • A surprising fact was discovered by statisticians Persi Diaconis, Ronald Graham, and W.M. Kantor. • It takes seven shuffles. Fewer than seven leaves order in the deck, but after that, more shuffling does little good.
It’s Not Easy Being Random • There are ways to generate random numbers so that they are both equally likely and truly random. • The best ways we know to generate data that give a fair and accurate picture of the world rely on randomness, and the ways in which we draw conclusions from those data depend on the randomness, too.
Three Methods of Determining the Chance of an Event Occurring • Try to estimate the likelihood of a result of interest by actually carrying out the experiment many times and calculating the result’s relative frequency. • Drawbacks – slow, costly, often impractical or logistically difficult. • Develop a probability model and use it to calculate a theoretical answer. (Later Chapters) • Start with a model that, in some fashion, reflects the truth about the experiment, and then develop a procedure for imitating-or simulating-a number of repetitions of the experiment.
Practical Randomness • Suppose a cereal manufacturer puts pictures of athletes on cards in boxes of cereal to boost sales. The manufacturer announces that 20% of the boxes contain a picture of Tiger Woods, 30% a picture of David Beckham, and the rest a picture of Serena Williams. • You want all three pictures. How many boxes of cereal do you expect to have to buy in order to get the complete set? • How can we answer questions like this? • We need an imitation of a real process so we can manipulate and control it. • In short, we are going to simulate reality.
Simulation • Definition – The imitation of chance behavior, based on a model that accurately reflects the experiment under consideration. • Simulation is a powerful tool for gaining insight into events whose outcomes are random.
A Simulation • The sequence of events we want to investigate is called a trial. • The basic building block of a simulation is called a component. • Trials usually involve several components. • After the trial, we record what happened—our response variable. • Use random digits from a table, graphing calculator or computer software to simulate many repetitions.
Simulation • Modeling the Outcomes • Assign digits to represent outcomes so the digits will occur with the same long-term relative frequency as the actual outcomes. • Examples: • Choose a person at random from a group of which 70% are employed. • One digit simulates one person • 0,1,2,3,4,5,6 – employed • 7,8,9 - unemployed
Simulation • Examples: • Choose one person at random from a group of which 73% are employed. • Now two digits simulate one person • 00,01,02,03,…,72 – employed • 73,74,75,78,…,99 - unemployed • Choose one person at random from a group of which 50% are employed, 20% are unemployed, and 30% are not in the labor force. • One digit simulates one person • 0,1,2,3,4 – employed • 5,6 – unemployed • 7,8,9 – not in labor force
Simulation • Your Turn: • Choose a frozen yogurt flavor. Orders of frozen yogurt flavors (based on sales) have the following relative frequencies: 38% chocolate, 42% vanilla, and 20% strawberry. • Two digits simulate a yogurt flavor. • 00 to 37 – chocolate • 38 to 79 – vanilla • 80 to 99 - strawberry
SimulationStep-By-Step • Identify the component to be repeated. • Explain how you will model the outcome (assign digits). • Explain how you will simulate the trial. • State clearly what the response variable is. • Run several trials. • Analyze the response variable. • State your conclusion (in the context of the problem, as always).
Simulation Example • Suppose a cereal manufacturer puts pictures of famous athletes on cards in boxes of cereal in the hope of boosting sales. The manufacturer announces that 20% of the boxes contain a picture of Tiger woods, 30% a picture of Lance Armstrong, and the rest a picture of Serena Williams. You want all three pictures. • How many boxes of cereal do you expect to have to buy in order to get the complete set?
Simulation Example • Identify the component to be repeated. • The selection of a cereal box. • Explain how you will model the outcome (assign digits). • 0,1 – Woods • 2,3,4 – Armstrong • 5,6,7,8,9 – Williams
Simulation Example • Explain how you will simulate the trial. • A trial is the sequence of events that we are pretending will take place. • In this case we want to pretend to open cereal boxes until we have one of each picture. • So one trial of the simulation is the number of boxes opened until we’ve gotten all three pictures.
Simulation Example • State clearly what the response variable is. • What are we interested in? • We want to know how many boxes it takes to get all three pictures. • This is the response variable. • Run several trials. • The more trails you run the more accurate your result.
Simulation Example • Running Trials (Table B line 130) Trial # Outcomes # Boxes 1 6905164 Williams, Williams, Woods,Williams,7 Woods, Williams,Armstrong 2 81787174Williams,Woods,Williams, Williams, 8 Williams,Woods,Williams, Armstrong 3 0951784Woods, Williams, Williams, Woods,7 Williams, Williams, Armstrong
Simulation Example Trial # Outcomes # Boxes 4 5340Williams,Armstrong, Armstrong, Woods 4 5 64898720Williams,Armstrong,Williams, Williams 8 Williams, Williams, Armstrong, Woods 6 1972Woods, Williams, Williams, Armstrong4 • Create a chart to keep track of the results.
Simulation Example • Analyze the response variable. • We wanted to know how many boxes we might expect to buy, so we calculate the average number of boxes per trail. • Average (7+8+7+4+8+4)/6 = 6.3 • State your conclusion (in the context of the problem, as always). • Based on our simulation, we estimate that customers who want the complete set of sports star pictures will buy an average of 6.3 boxes.
Simulation Problem • 57 students participated in a lottery for a particularly desirable dorm room – a triple with a fireplace and private bath in the tower. 20 of the participants were members of the same varsity sports team. When all 3 winners were members of the team, the other students cried foul. Use a simulation to determine whether an all-team outcome could reasonably be expected to happen if everyone had a fair shot at the room.
Simulation Problem • Identify the component to be repeated. • Selection of a student • Explain how you will model the outcome (assign digits). • Look at two digit random numbers • 00-19 represent the 20 varsity team members • 20-56 represent the other 37 students • 57-99 skip as unused numbers
Simulation Problem • Explain how you will simulate the trial. • Each trial consists of picking pairs of random digits as V (varsity) or N (non-varsity) until 3 people are chosen, ignoring out-of-range or repeated numbers (X). • State clearly what the response variable is. • Whether are not all the selected students are on the varsity team.
Simulation Problem • Run several trials. (use Table B line 101) Trial # Outcomes All Varsity 1 19V,22N,39N no 2 50N,34N,05V no 3 75X,62X,87X,13V,96X no 40N, 91X,25N 4 31N,42N,54N no 5 48N,28N,53N no
Continued Trials Trial # Outcomes All Varsity 6 73X,67X,64X,71X,50N no 99X,40N,00V 7 19V,27N,27X,75X,44N no 8 26N,48N,82X,42N no 9 53N,62X,90X,45N,46N no 10 77X,17V,09V,77X,55N no 11 80X,00V,95X,32N,86X, no 32N
Continued Trials Trial # Outcomes All Varsity 12 94X,85X,82X,22N,69X no 00V,56N 13 52N,71X,13V,88X,89X no 93X,07V 14 46N,02V,27N no 15 40N,01V,18V no 16 58X,48N,48N,76X,75X no 25N
Continued Trials Trial # Outcomes All Varsity 17 73X,95X,59X,29N,40N no 07V 18 69X,97X,19V,14V,81X no 60X,77X,95X,37N 19 91X,17V,29N,75X,93X no 35N 20 68X,41N,73X,50N,13V no
Simulation Problem • Analyze the response variable. • “all varsity” occurred zero times out of 20 trials or 0% of the time. • State your conclusion (in the context of the problem, as always). • In our simulation of “fair” room draws the three people chosen were all varsity team members 0% of the time (for 20 draws). It is not particularly likely a fair draw would pick all varsity team members and we should be suspicious of the stated outcome.
Calculator Simulation • Instead of using coins, dice, cards, or tables of random numbers, you can use the TI-83/84 calculator for simulations. • There are several random number generators offered in the MATH PRB menu. • randInt(0,1) randomly chooses a 0 or a 1. Effective simulation of a coin toss. • randInt(1,6) produces a random integer from 1 to 6, a good way to simulate rolling a die. • randInt(1,6,2) simulates rolling 2 dice. To do several rolls in a row, just hit ENTER repeatedly. • randInt(0,56,3) produces 3 random integers between 0 & 56, a good way to simulate the dorm room lottery.
Calculator Simulation Problem • A basketball player makes 70% of her free throws in a long season. In a tournament game she shoots 5 free throws late in the game and misses 3 of them. The fans think she was nervous, but the misses may be due to chance. • Simulate an experiment to determine which it is?
Calculator Simulation Problem • Identify the component to be repeated. • Shooting free throws • Explain how you will model the outcome (assign digits). • Each single digit represents a free throw • 0 – 6 represents a made free throw • 7-9 represents a missed free throw • Explain how you will simulate the trial. • Each trial will consist of 5 shots ( 5 random numbers from 0 to 9) to determine if she has 3 or more misses.
Calculator Simulation Problem • State clearly what the response variable is. • Whether she has 3 or more misses. • Run several trials. (124 rand) • Run 50 trials and count the number of times she has 3 or more misses. • randInt(0,9,5) – 50 times • Analyze the response variable. • 3 or more misses occurred 11 times out of 50 trials.
Calculator Simulation Problem • State your conclusion (in the context of the problem, as always). • In our simulation she missed 3 or more free throws only 11 out of 50 times or 22%. • We therefore conclude she choked.
Simulation Cautions • Don’t overstate your case. • In some sense a simulation is always wrong. After all, it’s not the real thing. We didn’t buy any cereal, or run a room draw. So beware of confusing what really happens with what a simulation suggests might happen. Always be sure to indicate that future results will not match your simulated results exactly.
Simulation Cautions • Model the outcome chances accurately. A common mistake in constructing a simulation is to adopt a strategy that may appear to produce the right kind of results, but that does not accurately model the situation. If your simulation overlooks important aspects of the real situation, your model will not be accurate.
Simulation Cautions • Run enough trials. Simulation is cheap and fairly easy to do. Don’t try to draw conclusions based on 5 or 10 trials (even though we did for illustration purposes here). The larger the number of trials the better.
What have we learned? • How to harness the power of randomness. • A simulation model can help us investigate a question when we can’t (or don’t want to) collect data, and a mathematical answer is hard to calculate. • How to base our simulation on random values generated by a computer, generated by a randomizing device, or found on the Internet. • Simulations can provide us with useful insights about the real world.
Assignment • Pg. 265 – 267: #9, 11, 12, 13, 15, 19, 25