
Introduction:
Fig.1. Observational sites:. Airborne and surface measurements :. in Nov./Dec. 2011 over Gan-Island (Maldives, 0°, . Particle Imagers CIP : 20 - 1000 µm 2DS : 10 - 1000 µm PIP : 100µm – 6mm Fig1: composite cloud particle spectrum.

Introduction:
E N D
Presentation Transcript
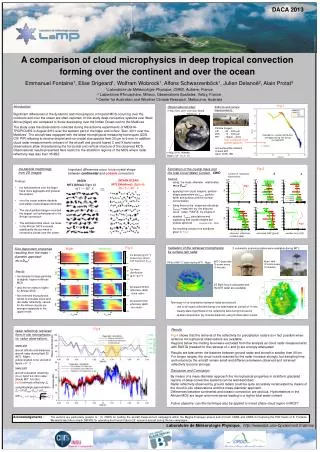
Fig.1 Observational sites: Airborne and surfacemeasurements : in Nov./Dec. 2011 over Gan-Island (Maldives, 0°, Particle ImagersCIP : 20 - 1000 µm2DS : 10 - 1000 µmPIP : 100µm – 6mmFig1: composite cloud particle spectrum and surface Rain RadarsC-band MITXport LTHE, IRD in Aug. 2010 Niamey (Niger) (13°N, 3°E) 3 mm DACA 2013 Example for number distribution averaged during 10s during the flight #20 A comparison of cloud microphysics in deep tropical convection forming over the continent and over the ocean Emmanuel Fontaine1, Elise Drigeard1, Wolfram Wobrock1, AlfonsSchwarzenböck1, Julien Delanoë2, Alain Protat3 1Laboratoire de Météorologie-Physique, CNRS, Aubière, France 2Laboratoire ATmosphère, Milieux, Observations Spatiales, Velizy, France 3Center for Australian and Weather Climate Research, Melbourne, Australia Introduction: Significant differences in the dynamics and microphysics of tropical MCS occurring over the continent and over the ocean are often reported. In this study deep convective systems over West Africa (Niger) are compared to those developing over the Indian Ocean next to the Maldives. The study uses the observations collected during the airborne experiments of MEGHA-TROPIQUES in August 2010 over the western part of the Niger and in Nov. /Dec. 2011 over the Maldives'. The aircraft was equipped with the latest microphysical measuring techniques (2DS, CIP, PIP) allowing to resolve droplet and ice crystal size spectra from 25 μm to 6 mm. In addition cloud radar measurements onboard of the aircraft and ground based C and X band radar observations allow characterizing the horizontal and vertical structure of the observed MCS. Observational results presented here restrict to the stratiform regions of the MCS where radar reflectivity was less then 35 dBZ. Fig.1 Ice particle morphology from 2D images: Fig.2 Estimation of the crystal mass andthe total Cloud Water Content CWC: Important differences occur in ice crystal shape between continental and oceanicconvection number of individualβαobservations • Method:using the mass–diameter relationship: m= a Dmaxb • applying from cloud imagers: particleshape parametersas Lmax, particle width and surface and the number concentration • fitting them to the observed reflectivity Z94GHz measured by the airborne cloud radar ‘RASTA’ by means of • detailed Tmatrix calculations and supposing that crystal shapes are prolate spheroid(Fontaine et al. , 2013)the resulting values for a and b are given in Fig.2 INDIAN OCEAN MT2 (Maldives): flight 46 -26 < T < -30°C NIGER MT1 (Africa): flight 18 at T ~ – 26°C • Findings: • Ice hydrometeors over the Nigerhave more aggregate and graupel- like shapes • over the ocean pristine dendrite and stellar crystal shapes dominate • The cloud particle Imager recorded the largest ice hydrometeors in theAfrican convection • The estimated total cloud ice mass in the African MCS exceeds significantly the ice mass in convective clouds over the ocean Niger Maldives’ Maldives’ Niger observed reflectivity calculated CWC (g/m3) number conc. (#/l)at 94GHz (dBZ) Fig.3 Validation of the retrieved microphysicsby surface rain radar 2 volumetric scanning radars were available during MT1: NigerMaldives’ Size dependent propertiesresulting from the mass –diameter approachm= a Dmaxb Ice density (g cm-3)(supposing a spherewith equivalent Dmax) Xport with12 scans every12 minutes MIT C-band with15 scans every10 minutes PPIs of MIT C-band during MT1, Niger Ice mass distribution(g m-3 µm-1) • Results • Ice density for large particles is slightly higher in African MCS • also the ice mass is higher for African MCS • the retrieved microphysics allows to simulate cloud and rain radar reflectivity: values for the African clouds are stronger especially in the upper levels 25 flight hours collocated withthe MIT radar are available Simulated 94 GHz reflectivity (dBZ)- cloud radar - Simulated 9 GHz reflectivity (dBZ)- rain radar - • Technique of co-localization between radar and aircraft: • - use of all scans collected during one observational period of 10 min- steady state hypothesis of the reflectivity field during this period - spatial interpolation (by inverse distance) using 8 observation points Fig.4 Results Fig.4 shows that the retrieval of the reflectivity for precipitation radars is in fact possible when airborne microphysical observations are available.Regions below the melting level were excluded from the analysis as cloud radar measurements with RASTA (needed for the retrieval of a and b) are strongly attenuated. Results are best when the distance between ground radar and aircraft is smaller then 80 km. For longer ranges, the cloud voxels scanned by the radar increase strongly, but sampling time and volume by the aircraft remain small and difference between observed and retrieved reflectivity become stronger. radar reflectivity retrievedfrom in-situ microphysicsvs. radar observations: upper plot aircraft altitude and distances aircraft-radar during flight 20 (MT1, Niger);yellow shaded zone: aircraft in layers > 0°C lower plot aircraft collocated reflectivity (blue) Xport 9.4 GHz radar(black) MIT 5.5 GHz(red) retrieved reflectivity Ze using Rayleigh approximationZe N (Dequi) Dequi6d Dequiwith Discussion and Conclusion: By means of a mass-diameter approach the microphysical properties in stratiform glaciated regions of deep convective systems can be well described. Radar reflectivity observed by ground radars could be quite accurately recalculated by means of the cloud in-situ observations and this mass-diameter approach.Differences between continental and oceanic convection are obvious. Hydrometeors in the African MCS are larger and more dense leading to a higher total water content.Future objective: can this technique also be applied to mixed phase cloud region in MCS? Acknowledgements : The authors are particularly grateful to : (1) CNES for funding the aircraft measurement campaigns within the Megha-Tropiques project and (2) both CNRS and CNES for financing the PhD thesis of E. Fontaine . We would also like to thank SAFIRE for operating the French Falcon 20 research aircraft during the two campaigns. Laboratoire de Météorologie Physique, http://wwwobs.univ-bpclermont.fr/atmos


