
Uploaded by
amadis
1 SLIDES
116 VIEWS
10LIKES
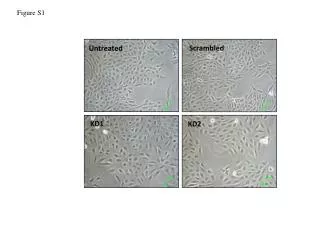
Scrambled Untreated KD1 KD2 Analysis - Figure S1
DESCRIPTION
This figure (Figure S1) presents a detailed analysis of the scrambled untreated conditions for KD1 and KD2 samples. The visual representation highlights key differences and similarities in the data, providing insights into the behavior of these samples under uncontrolled conditions. The focus is on the variations in response patterns, demonstrating significant aspects of the treatments studied. The results indicate essential trends that could inform future experiments and therapeutic strategies.
Download
1 / 1
Download Presentation 
Scrambled Untreated KD1 KD2 Analysis - Figure S1
An Image/Link below is provided (as is) to download presentation
Download Policy: Content on the Website is provided to you AS IS for your information and personal use and may not be sold / licensed / shared on other websites without getting consent from its author.
Content is provided to you AS IS for your information and personal use only.
Download presentation by click this link.
While downloading, if for some reason you are not able to download a presentation, the publisher may have deleted the file from their server.
During download, if you can't get a presentation, the file might be deleted by the publisher.
E N D


More Related