Download
1 / 18
180 likes | 335 Views
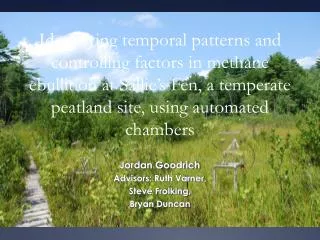
Identifying temporal patterns and controlling factors in methane ebullition at Sallie’s Fen, a temperate peatland site, using automated chambers. Jordan Goodrich Advisors: Ruth Varner, Steve Frolking, Bryan Duncan. Motivation. Recent return to high growth rate in the

E N D
Identifying temporal patterns and controlling factors in methane ebullition at Sallie’s Fen, a temperate peatland site, using automated chambers Jordan Goodrich Advisors: Ruth Varner, Steve Frolking, Bryan Duncan
Motivation Recent return to high growth rate in the atmospheric burden points to northern wetlands as contributor [Dlugokencky et al. 2009] Thawing permafrost may release large stores of carbon by enhancing CH4 emissions [e.g. Christensen et al. 2004] Identify local processes and mechanisms to help constrain global trends Abisko, Sweden: CAMEL Project
Wetland CH4 Anaerobic microbial production at depth creates a gradient with the overlying atmosphere Subsequent transport upward can occur via three pathways: diffusion, plant mediated transport and ebullition (bubbling) Bubbles form when pCH4(aq) exceeds hydrostatic pressure shown to contain up to 70% CH4 release has been related to falling atmospheric pressure and threshold peat bubble content
Objectives Use automated chambers to measure CH4 flux and quantify ebullition magnitude and frequency Characterize the controls on CH4 ebullition at various timescales (seasonal, synoptic, diel) Estimate the proportion of total CH4 flux contributed by ebullition at Sallie’s Fen
Site & Methods Sallie’s Fen is located in Southeast NH, USA (43º12.5’N, 71º3.5’W) - peat depth 2.0-4.5 m, basal date ~9500yrs Ten automated chambers close at random for either six or ten minutes at a time Chamber head space concentration over time is measured with a cavity ring-down spectroscopy analyzer (one measurement every 2 sec)
* Flux from this curve: 185.2 mgCH4 m-2 day-1
Water Table Effect Reduction in pressure on CH4 stored at depth[Windsor et al. 1992] Easier to transport through air than water - increased diffusivity [Moore and Roulet, 1993] No clear relationship with atmospheric pressure - unlike previous studies - e.g. Tokida et al. 2005, Tokida et al. 2007, Waddington et al. 2009
Cumulative Summary: Jun-Aug 2009 Episodic ebullition as percent of total: 2 - 12%
Conclusions Peat hydrology exhibits a strong control on CH4 ebullition on synoptic timescales Episodic ebullition can contribute a significant portion of the total CH4 released during summer months at Sallie’s Fen, but our estimate is smaller than other field chamber studies Modeling implications Will the proportion of total flux contributed by ebullition increase or decrease in a changing climate? In permafrost regions, will this pathway lead to significant release from carbon stored at depth?
Acknowledgements M.S. committee: Ruth Varner, Steve Frolking, Bryan Duncan Research & Discover Program (NASA & UNH) Michael Keller (Instrument) & Jack Dibb, Sallie Whitlow and Nicola Blake (Sallie’s Fen) Rob Braswell, Jill Bubier, Patrick Crill, Tom Milliman, Tuula Larmola Fellow students - Haley W., Claire T., Gennie N., Frankie S., Chelsea C., Eric K. Questions?
Ebullition Magnitude Distribution Indicative of poorly decomposed peat with open poor structure (i.e. low bulk density) Arbitrary model units [Coulthard et al. 2009]
Cumulative Summary - Summer only Scale the daily frequency estimates Based on area of each chamber Based on amount of time the chamber was closed each day Sample from the magnitude distribution Take random samples as many times as indicated by the scaled frequency estimate for each day Add them for each day to get a daily sum Bootstrap the sampling to get uncertainty estimate (95% Confidence Intervals)