Download
1 / 104
1.04k likes | 1.05k Views
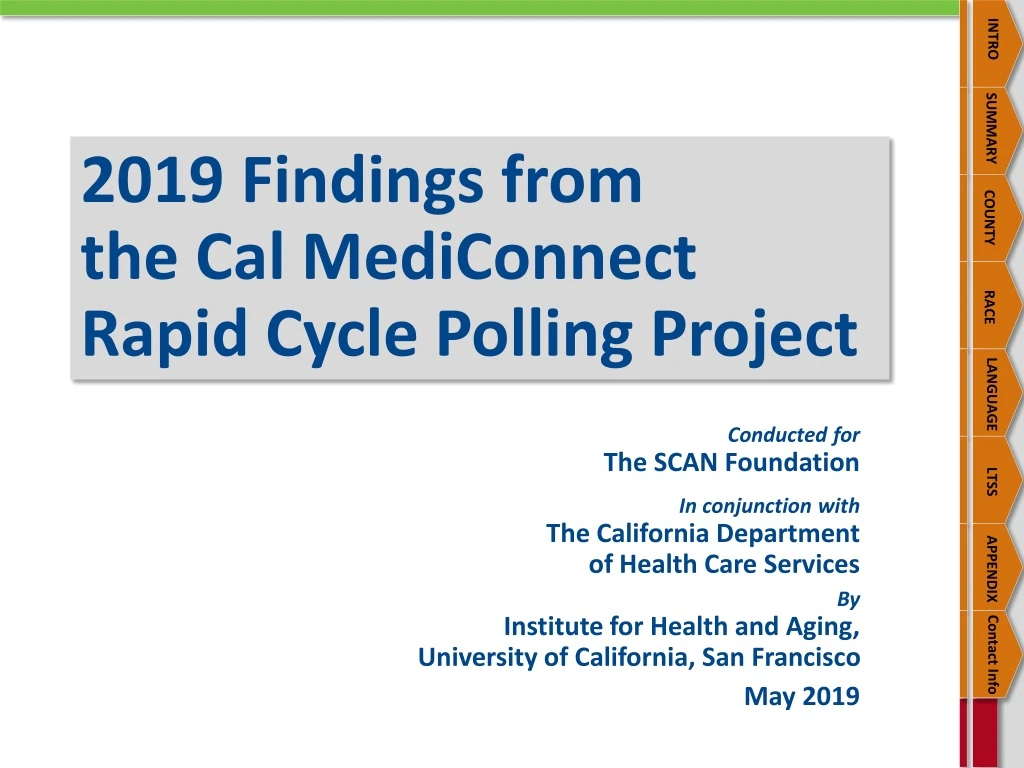
This report presents the findings from the Cal.MediConnect Rapid Cycle Polling Project, conducted in 2019, which examines the experiences of Cal.MediConnect (CMC) enrollees by county, race, language, and long-term services and supports (LTSS) needs. The report analyzes data from seven participating counties in California and provides insights on CMC enrollees' confidence in navigating health care.

E N D
INTRO SUMMARY COUNTY 2019 Findings from the Cal MediConnectRapid Cycle Polling Project RACE LANGUAGE LTSS Conducted forThe SCAN Foundation In conjunction withThe California Departmentof Health Care Services ByInstitute for Health and Aging, University of California, San Francisco May 2019 APPENDIX Contact Info
INTRO Report Objectives SUMMARY COUNTY Previous reports looked at overall frequencies and compared those in Cal MediConnect (CMC), to those who opted out and those in non-demonstration counties. The prime objective of these analyses was to compare CMC enrollees’ experiences by county, race, language, and disability using the following characteristics: • The seven participating counties: San Bernardino, San Diego, Santa Clara, San Mateo, Orange, Los Angeles, and Riverside • Race: White, Black, Asian/Pacific Islander, and Hispanic/Latino • Language of survey administration: English, Chinese, and Spanish • Need for Long-Term Services and Supports (LTSS): No LTSS need, those with routine needs only, and those with need for personal care assistance RACE LANGUAGE LTSS APPENDIX Contact Info
INTRO California’s Dual Financial Alignment Demonstration“Cal MediConnect” SUMMARY COUNTY • Background: In 2014, California implemented a dual financial alignment demonstration called the Coordinated Care Initiative. As part of this demonstration new integrated health plans, called Cal MediConnect (CMC), were created in seven counties for people eligible for both Medicare and Medi-Cal. • Dually eligible beneficiaries enrolled in CMC had all of their medical care, ancillary services, and long-term services and supports (LTSS) coordinated through one integrated managed care plan. • CMC enrollees received some new benefits such as care coordination and non-emergency transportation. • While specialty behavioral health was carved out, mild to moderate behavioral health benefits were provided through CMC, and CMC care coordinators were tasked with coordinating with specialty behavioral health county providers. RACE LANGUAGE LTSS APPENDIX Contact Info
INTRO About the Surveys SUMMARY COUNTY Survey Method • Telephone interviews with stratified random samples of dual eligible beneficiaries in Cal MediConnect (CMC) counties Populations Surveyed • 2015: CMC enrollees in five counties (Los Angeles, Riverside, San Bernardino, San Diego, and Santa Clara) • 2016 through 2018: CMC added two counties (San Mateo and Orange) Sample Sizes of CMC Enrollees by Survey Year • 2015: 2,764 CMC enrollees • 2016: 3,351 CMC enrollees • 2017: 1,779 CMC enrollees • 2018: 1,775 CMC enrollees Aggregate Sample Size of CMC Enrollees (across all years) • 9,669 CMC enrollees RACE LANGUAGE LTSS APPENDIX Contact Info
INTRO CMC Enrollees by County SUMMARY COUNTY Sample of CMC Enrollees by County and Year RACE LANGUAGE LTSS APPENDIX Contact Info
INTRO CMC Enrollees by Race and Language SUMMARY COUNTY Sample of CMC Enrollees by Race and Language of Survey Administration and Year *Note: Race sample size=8907. Respondents who answered “other” or “not recorded” were excluded from the analysis. RACE LANGUAGE LTSS APPENDIX Contact Info
INTRO CMC Enrollees by Need for Long-Term Services and Supports SUMMARY COUNTY Sample of CMC Enrollees by Type of LTSS Needs and Year RACE LANGUAGE LTSS * This item about LTSS needs distinguished between no LTSS needs, personal care needs, and routine care needs and was only asked in 2017 and 2018. ** Routine needs were defined as needing help with everyday household chores, doing necessary business, shopping or getting around for other purposes. This category only includes those who need only routine care, and does not include those who need both routine and personal care. *** Personal care needs were defined as needing help with eating, bathing, dressing, or getting around inside the home. Most people who needed personal care also needed routine care. APPENDIX Contact Info
INTRO SUMMARY COUNTY RACE SummaryFindings in Brief LANGUAGE LTSS APPENDIX Contact Info
INTRO CMC Enrollees’ Confidence Navigating Health Care SUMMARY COUNTY Confidence navigating health care was fairly high for all CMC enrollees, and seemed to increase between 2015 to 2018. While there were no significant differences in 2018 by county, there were some significant differences by race, language, and disability. By race, Asian/Pacific Islanders (API) expressed less confidence than White or Black groups in their confidence managing their health conditions, knowing who to call, and getting their questions answered. By language, English-speaking CMC enrollees were significantly more likely to be “very confident” on all measures compared to Spanish speakers and Chinese-speaking enrollees. By disability, those CMC enrollees who had no LTSS needs expressed higher confidence that they could manage their health conditions and that they could get their questions answered compared to CMC enrollees with only routine needs, or those with personal care needs. RACE LANGUAGE LTSS APPENDIX Contact Info
INTRO CMC Enrollees’ Satisfaction with Health Care Services SUMMARY COUNTY There were some significant differences across counties in satisfaction with choice of doctors and choice of hospitals by race, language, and disability. By race, there were significant differences across all satisfaction questions. In particular, Latinos were least likely to say they were “very satisfied” with their choice of doctors and hospitals. Both Latinos and API were least likely to be very satisfied with their ability to call a health provider regardless of the time of day. By language, English-speaking CMC enrollees were most likely to be satisfied with almost all aspects of their health care compared to Spanish- and Chinese- speaking enrollees. By disability, CMC enrollees with personal care needs were the most satisfied with the hospitals they could use. Those with no LTSS needs were most satisfied with how long they had to wait to see a doctor when they needed an appointment. RACE LANGUAGE LTSS APPENDIX Contact Info
INTRO CMC Enrollees’ Problems Encountered with Health Care SUMMARY COUNTY There were few differences by county in problems encountered with health care, with the exception of a question only asked of non-English-speaking enrollees about access to interpreters. Those in Santa Clara and San Mateo Counties were the most likely to say they were not provided an interpreter when they needed one. By race, White enrollees were most likely to report misunderstandings about coverage, denied treatment, or that a doctor was not available. In contrast, API enrollees were most likely to report problems accessing interpreters, transportation problems, and trouble communicating with providers. Language was similar to race in that English-speaking enrollees were most likely to report misunderstandings about coverage, denied treatment, or that a doctor was not available. Chinese–speaking enrollees were most likely to report problems accessing interpreters and transportation problems. CMC enrollees with personal care needs were more likely than those with routine needs or no needs to report problems in all six areas queried. RACE LANGUAGE LTSS APPENDIX Contact Info
INTRO CMC Enrollees’ Experiences with a Personal Doctor* SUMMARY COUNTY By 2018, CMC enrollees in San Mateo County were the most likely to say they had a personal doctor. They were also the most likely to say that their personal doctor was the same doctor they had before they transitioned to CMC. By race, API CMC enrollees were the most likely to report having a personal doctor and also the most likely to say their doctor was the same that they had before CMC. White CMC enrollees were the most likely to say they had been seeing their personal doctor for a year or less. Similarly, by language, 100% of Chinese-speaking CMC enrollees said they had a personal doctor and they were the most likely to have been seeing the same doctor since before CMC. By disability, CMC enrollees with personal care needs were the most likely to say they had a personal doctor and slightly more likely than those with no LTSS needs or routine needs to say they had the same doctor since before CMC. RACE LANGUAGE LTSS APPENDIX Contact Info * A “personal doctor” was defined in the survey as “the doctor who knows you best and can refer you to other doctors when you need to see a specialist.”
INTRO CMC Enrollees’ Use of Single Care Managers and Personal Care Plans SUMMARY COUNTY There were few differences by county in those who reported having a single care manager,* with the exception that CMC enrollees in San Mateo County who did have a single care manager were the most likely to say their single care manager was from the plan. By race, API were the most likely to report having a single care manager, but the least likely to report having a personal care plan.** Latino and Black CMC enrollees who had a single care manager were most likely to say that the single care manager improved their care “a lot.” By language, English-speaking CMC enrollees were the most likely to report they had a single care manager and personal care plan. Chinese speakers who had a single care manager were the least likely to say it had improved their care “a lot.” By disability, those with personal care needs were significantly more likely to have a single care manager and personal care plan compared to those with no LTSS needs or only routine needs. RACE LANGUAGE LTSS APPENDIX Contact Info * A single care manager was defined in the survey as a nurse or other helper from their health plan who serves as their main point of contact and can arrange all aspects of their care.** A personal care plan was defined in the survey as a plan designed to take into account their health goals, needs and preferences.
INTRO CMC Enrollees’ Long-Term Services and Supports Needs and Use of In-Home Supportive Services SUMMARY COUNTY There were significant differences by county in the percentage of CMC enrollees getting assistance with care needs, getting In-Home Supportive Services (IHSS), their monthly IHSS hours, and unmet needs for personal care*. By race, API CMC enrollees were the most likely to say that they need assistance with personal care and reported the highest unmet needs. API and Black CMC enrollees were more likely than White and Latino enrollees to report using IHSS. By language, Chinese-speaking CMC enrollees were the most likely to report having needs for assistance with personal care, using IHSS, and the most likely to report unmet needs for personal care. By disability, those with personal care needs were most likely to get assistance with personal care, most likely to get IHSS, and had the highest average monthly hours compared to those with fewer needs. They were also the most likely to have unmet needs. RACE LANGUAGE LTSS APPENDIX Contact Info * Personal care needs defined as: eating, bathing, dressing, or getting around inside the home. ** Routine needs defined as: everyday household chores, doing necessary business, shopping or getting around for other purposes
INTRO SUMMARY COUNTY RACE Results by CMC Counties LANGUAGE LTSS APPENDIX Contact Info
INTRO CMC Enrollees’ Confidence Navigating Health Care by County SUMMARY COUNTY CMC enrollees across all counties expressed high levels of confidence in navigating their health care. In 2015, just under half of enrollees in all counties said they were very confident they knew how to manage their health conditions. By 2017, over half of CMC enrollees in most counties said they were very confident, with no significant differences by county. A majority of enrollees also said they “know who to call” if they have a health need or a question about their health. The only year there was a significant difference across counties was in 2017, when San Mateo County had the highest percentage of endorsement at 93% and Los Angeles County had the lowest endorsement at 85%. By 2018, there were no longer significant differences by county. RACE LANGUAGE LTSS APPENDIX Contact Info
INTRO CMC Enrollee Confidence Getting Questions Answered by County - 2018 SUMMARY COUNTY RACE LANGUAGE LTSS APPENDIX Contact Info P-VALUE: 0.043
INTRO Personal Doctor by County SUMMARY COUNTY In 2018, for the first time there were differences by county in CMC enrollees who said they had a personal doctor. 100% of San Mateo County enrollees said they had a personal doctor, while 89% of San Diego County CMC enrollees said they had a personal doctor. In 2016 (the first year that San Mateo County was included), 76% of CMC enrollees in San Mateo County said that they still had the same personal doctor they had before enrolling in CMC. By 2018, San Mateo County was still the highest at 70%, with Orange County the lowest at 59%. RACE LANGUAGE LTSS APPENDIX Contact Info
INTRO Personal Care Doctor by County - 2016 and 2018 SUMMARY COUNTY RACE LANGUAGE LTSS APPENDIX Contact Info
INTRO Choice of Providers by County SUMMARY COUNTY In 2018, 91% of San Mateo County CMC enrollees said they were very or somewhat satisfied with their choice of doctors (the highest of all the counties). In 2018, over 90% of San Mateo County and San Bernardino County CMC enrollees said they were very or somewhat satisfied with their choice of hospitals (the highest of all the counties). RACE LANGUAGE LTSS APPENDIX Contact Info
INTRO Choice of Doctor by County SUMMARY COUNTY RACE LANGUAGE LTSS APPENDIX Contact Info P-VALUE: 0.012
INTRO Choice of Hospital by County SUMMARY COUNTY RACE LANGUAGE LTSS APPENDIX Contact Info P-VALUE: 0.019
INTRO Specific Problems with Health Care Services by County SUMMARY COUNTY Relatively small proportions of CMC enrollees said they encountered any of six specific problems relating to their health services in the recent past. The only specific problem that was significantly different by county was among non-English-speaking enrollees who were asked if their doctor did not speak their language and an interpreter was not provided. The highest percentages were reported by CMC enrollees in Santa Clara County (36%) and San Mateo County (30%). The lowest percentages were reported in Riverside and San Bernardino Counties (8% and 6%, respectively). RACE LANGUAGE LTSS APPENDIX Contact Info
INTRO Specific Problems with Health Care Services – 2018 (1) SUMMARY COUNTY Had a misunderstanding about your health care services or coverage RACE LANGUAGE LTSS Was denied a treatment or referral for another service recommended by a doctor APPENDIX Contact Info
INTRO Specific Problems with Health Care Services – 2018 (2) SUMMARY COUNTY RACE Transportation problems kept you from getting needed health care LANGUAGE LTSS APPENDIX A doctor you were seeing is not available through your plan Contact Info
INTRO Specific Problems with Health Care Services – 2018 (3) SUMMARY COUNTY RACE Had trouble communicating with a health provider because of a speech, hearing or other disability LANGUAGE LTSS APPENDIX Doctor did not speak your language and there was not an interpreter available by county* * P-VALUE: <0.001 Contact Info
INTRO Single Care Manager and Personal Care Plan by County SUMMARY COUNTY There were no significant differences by county in the percent of CMC enrollees who reported having a single care manager or personal care plan. Of those who did have a single care manager in 2018, 88% of San Mateo County CMC enrollees said their single care manager was from the plan (highest %), compared to 56% of Orange County CMC enrollees (lowest %). Thirty-five percent of Santa Clara County CMC enrollees who did not have a single care manager said that having one would improve their care “a lot.” RACE LANGUAGE LTSS APPENDIX Contact Info
INTRO Single Care Manager by County SUMMARY COUNTY RACE LANGUAGE LTSS APPENDIX Contact Info P-VALUE: 0.001
INTRO Single Care Manager from the CMC Plan SUMMARY COUNTY RACE LANGUAGE LTSS APPENDIX Contact Info P-VALUE: 0.011
INTRO Health and Disability Related Characteristics of CMC Enrollees by County SUMMARY COUNTY In 2018, there were NO differences in health/disability characteristics by county in the following measures: Self-rated health Hospital admissions Use of mental health services Use of medical equipment and supplies Deaf or serious difficulty hearing Blind or serious difficulty seeing while wearing glasses Difficulty walking or climbing stairs Difficulty dressing or bathing Doing errands alone or visiting a doctor’s office or shopping RACE LANGUAGE LTSS APPENDIX Contact Info
INTRO Getting Services or Assistance with Personal Care and Routine Care by County SUMMARY COUNTY In 2018 there were differences by county in: Getting services or assistance with bathing, dressing, help preparing meals, help doing housework, or grocery shopping. San Bernardino County at 29% and Orange County at 19% were the lowest. Those with a disability using In-Home Supportive Services (IHSS). Orange and San Diego Counties were the lowest at 15% and 20%, respectively; Los Angeles, Santa Clara and San Mateo Counties were the highest at 34%. Average number of monthly IHSS hours among users differs significantly by county. Orange County was the lowest at 72 hours, while San Mateo and Santa Clara Counties were the highest at over 100 hours. There was no significant difference by county in unmet needs reported for personal or routine care. Between 32% and 46% in all the counties reported they ”could use more help with personal care needs.” RACE LANGUAGE LTSS LTSS NEED APPENDIX
INTRO Getting Services or Assistance with Routine or Personal Care - 2018 SUMMARY COUNTY RACE LANGUAGE LTSS APPENDIX Contact Info Personal care needs P-VALUE: 0.020; Routine care needs P-VALUE: 0.016
INTRO Getting All the Help Needed for Personal Care Needs by County - 2018 SUMMARY COUNTY RACE LANGUAGE LTSS APPENDIX Contact Info
INTRO Getting Services or Assistance with Bathing, Dressing, Help with Preparing Meals, Housework or Shopping by County SUMMARY COUNTY RACE LANGUAGE LTSS APPENDIX Contact Info P-VALUE: <0.001
INTRO IHSS Use Among People with LTSS Needs – 2017 and 2018 SUMMARY COUNTY RACE LANGUAGE LTSS APPENDIX Contact Info Asked only of enrollees who report using LTSS, 2017 & 2018 P-VALUE: <0.001
INTRO IHSS Use Among People with LTSS Needs SUMMARY COUNTY RACE LANGUAGE LTSS APPENDIX Contact Info Asked only of enrollees who report using IHSS
INTRO SUMMARY COUNTY RACE Results by Race LANGUAGE LTSS APPENDIX Contact Info
INTRO Enrollees’ Confidence Navigating Health Care by Race SUMMARY COUNTY In 2018, similar to previous years, White and Black CMC enrollees were significantly more likely than Latinos or Asian/Pacific Islander (API) enrollees to say: Very or somewhat confident they know how to manage their health conditions (91% of White and Black enrollees, compared to 77% of Latinos and 75% of API enrollees). Asian/Pacific Islanders were also least likely to say: They know who to call if they have a question about their health (82%, compared to 88% of Latinos, 94% of White and Black enrollees). They know how to get their questions answered (51%, compared to 64% of White and 66% Black enrollees). RACE LANGUAGE LTSS APPENDIX Contact Info
INTRO Enrollees’ Confidence Navigating Health Care by Race - 2018 SUMMARY COUNTY Know how to manage your health conditions (% very or somewhat confident) RACE LANGUAGE Know who to call if you have a health need or question (% yes) LTSS APPENDIX Can get questions about your health needs answered (% very or somewhat confident) Contact Info
INTRO Personal Doctor by Race SUMMARY COUNTY API CMC enrollees were most likely to have a personal doctor (98%). API CMC enrollees were also the most likely to have the same doctor they had before enrolling in CMC (75%, compared to 66% Black enrollees, 60% Latinos, and 53% of White CMC enrollees). White CMC enrollees were the most likely to have been seeing their personal doctor less than a year (21%). RACE LANGUAGE LTSS APPENDIX Contact Info
INTRO Has a Personal Doctor by Race - 2018 SUMMARY COUNTY RACE LANGUAGE LTSS APPENDIX Contact Info P-VALUE: 0.002
INTRO Satisfaction with Health Care Services by Race SUMMARY COUNTY There were significant differences by race for all questions related to satisfaction with care in 2018. Latinos were least likely to say they were “very satisfied” with their choice of doctors and hospitals in 2018 (only 25% were very satisfied). Both Latinos and API were the least likely to be very satisfied with their ability to call a health provider regardless of the time of day. RACE LANGUAGE LTSS APPENDIX Contact Info
INTRO Satisfaction with Health Care Services by Race SUMMARY Choice of Doctors – 2018 COUNTY RACE LANGUAGE LTSS APPENDIX Contact Info P-VALUE: <0.001
INTRO Satisfaction with Health Care Services by Race SUMMARY Choice of Hospitals – 2018 COUNTY RACE LANGUAGE LTSS APPENDIX Contact Info P-VALUE: <0.001
INTRO Satisfaction with Health Care Services by Race SUMMARY Information Given Explaining Benefits – 2018 COUNTY RACE LANGUAGE LTSS APPENDIX Contact Info P-VALUE: <0.001
INTRO Satisfaction with Health Care Services by Race SUMMARY Ability to Call Health Plan Regardless of Time of Day – 2018 COUNTY RACE LANGUAGE LTSS APPENDIX Contact Info P-VALUE: <0.001
INTRO Satisfaction with Health Care Services by Race SUMMARY Time Your Doctor and Other Staff Spend With You– 2018 COUNTY RACE LANGUAGE LTSS APPENDIX Contact Info P-VALUE: <0.001
INTRO Satisfaction with Health Care Services by Race SUMMARY Wait Time To See Your Doctor When You Need an Appointment – 2018 COUNTY RACE LANGUAGE LTSS APPENDIX Contact Info P-VALUE: <0.001
INTRO Satisfaction with Health Care Services by Race SUMMARY The Way Different Health Care Providers Work Together to Give You the Services You Need – 2018 COUNTY RACE LANGUAGE LTSS APPENDIX Contact Info P-VALUE: <0.001
INTRO Enrollees’ Experiences with Single Care Manager and Personal Care Plan by Race SUMMARY COUNTY API CMC enrollees were most likely to report they had a single care manager from the CMC plan (75% compared to 63% of Black enrollees). Latino and Black CMC enrollees who had a single care manager were most likely to say that the single care manager improved their care “a lot” (68% of Latinos and 65% of Black CMC enrollees, compared to only half of White or API enrollees). API CMC enrollees were least likely to have a personal care plan (only 18% of API, compared to about a quarter of White and Latinos, and 38% of Black enrollees). RACE LANGUAGE LTSS APPENDIX Contact Info